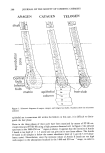
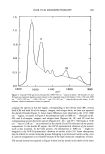
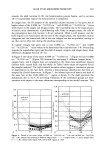
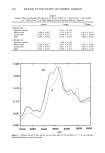
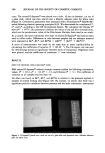
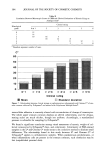
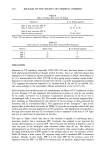
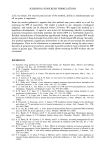
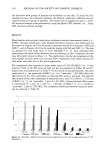
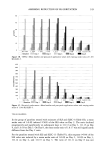
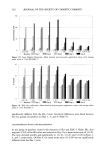
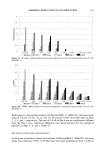
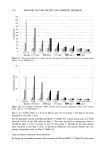
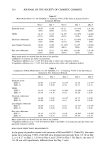
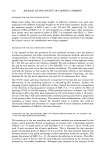
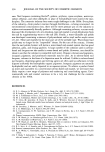
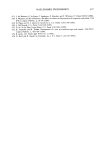
HAIR FT-IR MICROSPECTROSCOPY 293 towards the shaft (sections 8-10), the keratinization process begins, and in sections 10-15 (suprabulbar region) the keratinization is completed. In catagen hair, the IR analysis of the epithelial column (sections la-5a) gives rise to higher values of the A1080 cm- •/A1540 cm- • and A1080 cm- •/A1238 cm- • ratios with respect to the anagen and telogen trends. This is probably due to the large amount of nucleic acids characteristic of proliferating cells. Early in catagen phase, the cells of the presumptive hair club (section 1-8) are nucleated, DNA is still present, and the bulb begins to be keratinized. By the end of the catagen phase, the epithelial column disappears and the keratinized club of the new telogen hair has an epithelial coating or sac that can be often lost during the plucking process. A "naked" telogen hair gives rise to low A1080 cm-•/A1540 cm -• and A1080 cm- •/A1238 cm- • ratios values in the keratinized hair club (sections 1-8). Proceeding towards the suprabulbar region and the shaft of anagen, catagen, and telogen hairs, these differences disappear (section 10-15). In Figure 6 the values of the ratios A1080 cm-•/A1540 cm-• (Figure 5A) and A1080 cm-•/A1238 cm-• (Figure 5B) obtained by analyzing 9 different anagen hairs, 7 catagen hairs, and 6 telogen hairs are compared in the three most significant regions (inferior bulb, central bulb, and hair shaft). In Table I these values are reported for all the samples analyzed. The high standard deviation values suggest a continuous process of degeneration in the hair bulb, whereas a discontinuous classification has been at- tempted by clinical observation. In Figure 7, the infrared spectra of matrix and shaft of the same hair in the 3100-2800 cm-• region is shown. In the shaft spectrum the absorptions due to the C-H stretching vibrations of the methylene groups are more intensive with respect to the same vibrations corresponding to the methyl motions. This 0,7' 0,6 '•0,5 •0,4 ',r-- • 0,2 0,1 ß epithelial ß column ß ß ß ß ß ß - .-- .,..'-.. ', "" 33..-: : ,'.- .._...-_..:.. ...... .-._' T =.... • 1,8 ß epithelial .' column ß c ß ß " ' ' "'" ' ""' 3L.-: o A lB CB S B lB CB S Figure 6. Trends of the ratios values (A1080 cm-•)/(A1540 cm-z)-(A) and (A1080 cm-z)/(A1238 cm- z) (B), obtained by analyzing 9 different anagen hairs ( ), 7 catagen hairs (.-.), and 6 telogen hairs ( .... ). IB, inferior bulb region CB, central bulb region S, shaft.

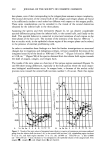
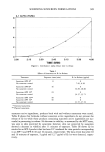
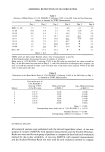
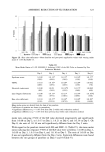
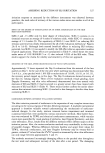
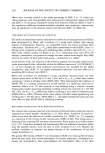
294 JOURNAL OF THE SOCIETY OF COSMETIC CHEMISTS Table I Average Values and Standard Deviations of the Ratios (A1080 cm-1)/(A1540 cm-1) and (A1080 cm-1)/(A1238 cm-1) at Three Different Levels of the Hair Bulb (cfr. Figure 6) Anagen Catagen Telogen A1080/A1540 Epithelial column 0.353 -+ 0.129 -- Inferior bulb 0.090 -+ 0.007 0.125 -+ 0.017 0.031 -+ 0.011 Central bulb 0.053 -+ 0.015 0.088 -+ 0.014 0.014 -+ 0.009 Shaft 0.095 -+ 0.019 0.110 -+ 0.028 0.086 -+ 0.020 A1080/A1238 Epithelial column -- 1.289 -+ 0.230 -- Inferior bulb 0.548 -+ 0.077 0.785 -+ 0.106 0.181 -+ 0.063 Central bulb 0.344 -+ 0.093 0.623 -+ 0.133 0.079 -+ 0.050 Shaft 0.672 + 0.142 0.782 + 0.122 0.618 - O. 149 0.25 I I I I i m 0.20 , ! ß ß ! i I 0.15 / S 0.10 i ,, 0.00 I I I l :31 O0 :3050 3000 2950 2900 2850 2800 cm-1 Figure 7. Infrared spectra of hair matrix (m) and hair shaft (s) (3100-2800 cm-1). In the ordinate, absolute absorbance values are reported.
Purchased for the exclusive use of nofirst nolast (unknown)
From: SCC Media Library & Resource Center (library.scconline.org)