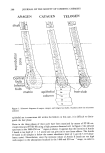
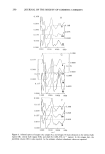
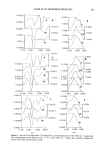
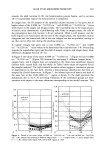
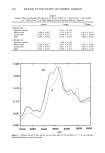
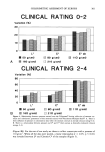
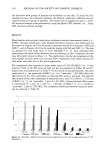
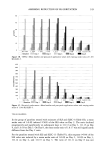
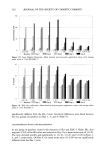
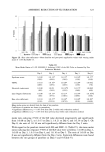
326 JOURNAL OF THE SOCIETY OF COSMETIC CHEMISTS RATIONALE FOR THE USE OF MOLAR RATIOS Molar ratios rather than percentage weights of surfactant mixtures were used since surfactants with different molecular weights can be more fairly compared. In this study, the molecular weights of SLEC-5 and -13 are 470 and 796, respectively (9). If the mixtures of SLS and SLEC-5 or -13 were prepared on a weight basis, there would have been almost twice the number of moles of SLEC-5 as compared with SLEC-13. How- ever, it should be pointed out that since product formulations are usually based on weight, conversion of the molar ratios to a weight basis may be necessary if, for example, the relative costs of the cosurfactants were being compared. RATIONALE FOR THE DATA REDUCTION SYSTEM A vast amount of data was generated for each surfactant mixture, since the protocol involved six panelists, ten molar concentrations, five evaluation methods, and seven sets of measurements. A data reduction system was an absolute necessity to provide man- ageable data for interpretation. To accomplish this, the degree of skin response caused by 1.0% SLS was used as the reference standard. For each evaluation method, on each day and for each panelist, the ratio of 1.0% SLS:SLEC-5 or -13 that induced •50% of the SLS value was used as the basis for further calculations. The molar ratio that caused only half the response as that caused by SLS was arbitrarily selected as the breakpoint. In the event of severe irritation that necessitated discontinuance of patching, the value obtained for the last patch application was used for all subsequent days' values. The •50% values used thus represented a conservative level that did not overstate the effectiveness of the modifying surfactant in overcoming SLS irritancy. Further, the stopping of patch application at SLS sites on Day 3 biased the molar ratio extrapolation in the direction of requiring greater amounts of SLEC-5 or -13 to achieve the effect of attaining •50% of the SLS response. If SLS patching had been continued, the •50% SLS irritancy effect may have been maintained at the ratios found on Day 3. However, the use of the Day 3 SLS values showed that continued patching did result in progression of the irritancy effect of the mixtures. This system of data transformation, with its final expression as molar ratios, reduced the recorded values to numbers that could be statistically analyzed and ultimately to a single number for each evaluation method that allowed comparison of different surfactant mixtures. VALIDATION OF THE TEST METHOD: EFFECT OF VARIOUS MOLAR RATIOS OF 1.0% SLS:SLEC-5 OR -13 ON THE SKIN IRRITATION RESPONSE The sensitivity of the test procedure and evaluation methods was demonstrated by the results, which generally showed a progression in irritancy with 1) decreasing amounts of SLEC-5 or-13 (molar ratios of 1.0% SLS:SLEC-5 or-13 from 1:1.00 to 1:0.08), and with 2) each successive day of patch application. This is illustrated by the consistent pattern of responses shown in Figures 1A-E and 2A-E. The skin irritation response was inversely related to the molar percentage of ether carboxylate within the mixtures. The greater the amount of SLEC-5 or -13, the greater the reduction in irritation. This effect occurred in spite of the fact that the total surfactant concentration in the mixtures was increased by the added cosurfactant. Although some variation in the intensity of the

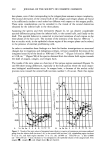
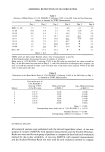
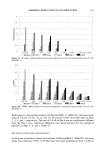
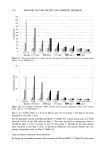
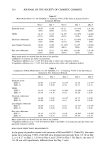
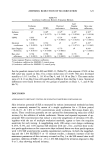
ASSESSING REDUCTION OF SLS IRRITATION 327 irritation response as measured by the different instruments was observed between panelists, the rank order of irritancy of the various molar ratios was similar in all of the participants. EFFECT OF THE DEGREE OF ETHOXYLATION OF AN ETHER CARBOXYLATE ON THE SKIN IRRITATION RESPONSE SLEC-5 and -13 differ only by their degree of ethoxylation. SLEC-5 contains in its chemical structure an average of 4 moles of ethylene oxide, while SLEC-13 contains an average of 11.4 moles (9). The superiority of SLEC-13 over SLEC-5 at reducing SLS irritancy potential was clearly demonstrated by all of the evaluation methods (cf. Figures 2A-E vs 1A-E). Although both exerted beneficial effects in reducing SLS irritancy potential, less SLEC-13 was needed to modify the SLS effect after an equivalent number of patch applications. These effects are summarized in Table V, which shows the mean molar ratios of 1.0% SLS:SLEC-5 or -13 that induced •50% of the SLS value. These results support the claims for validity and sensitivity of this test approach. RECOVERY OF THE SKIN AFTER DISCONTINUANCE OF PATCH APPLICATIONS Approximately 72 hours separated the Day 8 evaluations from the removal of the last patches on Day 5. In the case of the test sites where patching was discontinued after Day 3 or 4 (i.e., sites patched with 1.0% SLS or molar ratios of 1:0.08, 1:0.10, or 1:0.13), the recovery period ranged up to five days. The Day 8 evaluations showed recovery of the skin by varying degrees. Three of five evaluation methods (visual grading, laser Doppler flowmetry, and skin color reflectance) demonstrated that sites treated with mixtures of SLS and SLEC-13 had recovered to a greater extent than those treated with mixtures of SLS and SLEC-5 (Table V). These results further confirm the earlier obser- vations that mixtures containing SLEC-13 resulted in less damage to the skin than those containing SLEC-5. COMPARISON BETWEEN DIFFERENT EVALUATION METHODS The skin irritation potential of surfactants is the expression of very complex interactions occurring in the various regions of the skin following exposure. A multiple instrumental approach is therefore valuable toward understanding the mechanisms of surfactant- induced changes. In this study, stratum corneum barrier impairment and increased cutaneous blood flow were assessed by various noninvasive methods. Skin barrier func- tion was evaluated by TEWL and electrical conductance measurements, while vascular events were quantified by visual grading of erythema, laser Doppler flowmetry, and skin color reflectance, Thus, results from the different methods reflect different aspects of the irritation process. Also, the various evaluation methods vary considerably in their range of possible changes. Whereas differences between baseline and upper limit values for TEWL, electrical conductance, and laser Doppler flowmetry may be twenty-fold or greater, redness (a* values from the L*a*b* system) as measured by skin color reflectance can only range between approximately 5 and 15. The methods monitored increasingly damaging effects at the patched sites throughout the test week and subsequent recovery of the skin after a rest period. The damaging
Purchased for the exclusive use of nofirst nolast (unknown)
From: SCC Media Library & Resource Center (library.scconline.org)