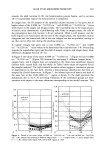
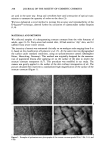
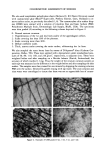
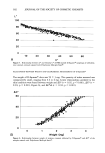
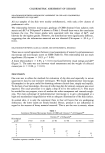
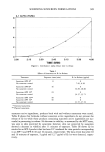
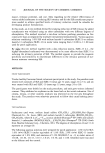
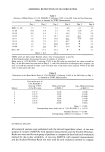
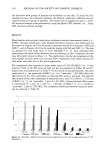
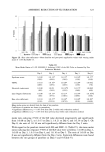
COLORIMETRIC ASSESSMENT OF XEROSIS 303 RELATIONSHIP BETWEEN MICROSCOPIC ASSESSMENT OF CSSB AND COLORIMETRIC MEASUREMENTS OF D-SQUAME © All our samples of dry skin were mainly orthokeratotic, with only a few clusters of parakeratotic cells. The relationship between microscopic gradings of CSSB obtained from subjects with xerosis and AC* of D-Squame © is shown in Table I. Overall there was a fair correlation between the two. The lowest grades were associated with low values of AC*, and likewise for the highest grades. However, the distributions were significantly different, suggesting that the information extracted was not identical (Chi-square = 20.4, p 0.01). RELATIONSHIP BETWEEN CLINICAL GRADES AND INSTRUMENTAL READINGS There was an overall agreement between visual assessments of xerosis by epiluminescence microscopy and microscopic scores on CSSB (Table II). This relationship did not reach significance (Chi-square = 94.9, p 0.01). A linear relationship (r = 0.83, p 0.01) was found between visual ratings and AC* (Figure 7). The same was true between visual assessments and the weight of collected corneocytes (r = 0.80, p 0.01). DISCUSSION Our aim was to refine the methods for evaluation of dry skin and especially to secure quantitative data by non-intrusive techniques. We found epiluminescence microscopy (Dermaphot) to be quite useful for obtaining relevant clinical data, simply and rapidly. To the best of our knowledge, this way of collecting data for stratum corneum was never reported. The usual procedure is to apply a drop of oil to the surface (6,7). This must be avoided for our purpose, since oil renders the scales transparent and conceals rough- ness. The main advantage of epiluminescence microscopy is to get a photograph at a high and standardized magnification with an adequate illumination of the skin surface. In normal skin, it is only the outermost three to four cell layers that are undergoing dehiscence the lower layers are firmly bonded. Hence, pressure is not influential in regard to the amount of horny material removed. This is not the case in xerosis, where Table I Correlation Between Microscopic Scores of CSSB and Chroma C* of D-Squame ©a Chroma C* of D-Squame © Histological grade 0-10 11-20 21-30 31-40 41-50 51-60 12 2 12 9 3 22 27 4 3 14 1 8 13 7 Numbers represent number of cases.

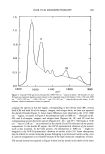
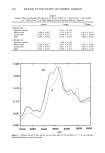
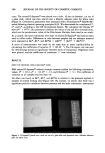
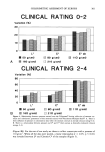
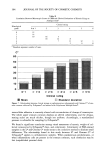
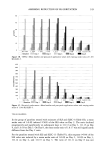
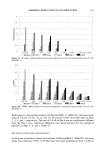
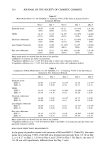
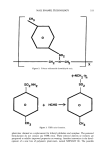
304 JOURNAL OF THE SOCIETY OF COSMETIC CHEMISTS Table II Correlation Between Microscopic Scores of CSSB and Clinical Evaluations of Xerosis Using an Analogue Scale a Clinical rating Histological grade 0 & 1 2 3 4 5 6 12 14 10 16 5 18 14 7 12 6 a Numbers represent number of cases. C* BO so 40 •o •o lO o 0-1 1-2 2-3 3-4 4-5 5-6 Clinical rating I• Mean [• Standard deviation Figure 7. Relationship between clinical ratings on epiluminescence photographs and Chroma C* of stra- tum corneum collected by D-Squame © and stained with Polychrome Multiple Stain ©. intercellular adhesion is unevenly altered with accumulation of clumps of corneocytes. The whole upper stratum corneum displays an altered cohesiveness, and the desqua- mating scales are much thicker, though not uniform. Accordingly, a standardized pressure is advisable for sampling by D-Squame ©. We found a significant correlation among visual assessment of xerosis, weight of col- lected corneocytes by D-Squame © discs, and colorimetry. Colorimetry of PMS-stained samples in the L* and Chroma C* mode seems to be a sensitive method to disclose small differences. The relationship found in this study between L* and Chroma C* of D-Squame © applies to orthokeratotic samples. When parakeratosis predominates, or when inflammatory cells are present in the stratum corneum, such correlation may be lost (unpublished personal data).
Purchased for the exclusive use of nofirst nolast (unknown)
From: SCC Media Library & Resource Center (library.scconline.org)