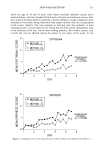
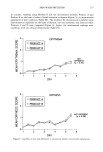
164 JOURNAL OF THE SOCIETY OF COSMETIC CHEMISTS been few studies of the changes in physical properties associated with wrinkling of the face skin. In this study, we compared age-related changes in the physical properties and devel- opment of wrinkles in face skin, and found correlations between the physical properties of facial skin and the extent of wrinkle formation. METHODS SUBJECTS A total of 170 healthy female volunteers (age 17-76 skin type II, III, IV) participated in this study. Measurements were performed on four anatomical regions: forehead (center), eye corners, cheek (cheek bone area), and mouth corners. All measurements were taken with volunteers seated in a room at a temperature of 20øC and a relative humidity between 40-50%. WRINKLE GRADING A photograph of each subject was taken using a Medical Nikkol with a diffused light electronic flash, which has a frame to ensure standardization of lighting, angle, and distance. All film (Fujichrome for color transparencies) originated from the same batch. The first frames of each role of film included a standard gray scale and color charts from the film manufacturer to facilitate color correction. Using these photographs, wrinkling of several portions of face skin were graded by two trained graders on a five-point scale defined as follows: 1 = none, 2 = mild, 3 = mild/moderate, 4 = moderate, 5 = severe. SKIN THICKNESS MEASUREMENT Skin thickness was measured with a 20-MHz A-mode ultrasound scanner (Dermascan A, Cortex Technology, Denmark) as described by Takema et al. (16), and expressed in mm. For calculation of skin thickness, an acoustic velocity of 1580 m/s was used. All measured values were expressed as the median value of three recordings. In subjects in whom a clear dermis-subcutaneous interface layer was not obtained due to the effects of the muscular tissues in the eye corners and cheek, measurements were repeated five times and the mean of three values was calculated after excluding the highest and lowest values. In addition, the location of the probe was moved until a clear interface layer appeared, and the point at which the skin thickness reached the minimum was selected. In some cases, B- or C-mode measurement was performed simultaneously with a C-mode ultrasound scanner (Dermascan C, Cortex Technology, Denmark). SKIN ELASTICITY MEASUREMENT Skin elasticity was measured with a commercially available instrument (Cutometer SEM 474, Courage and Khazaka, Cologne, Germany) as described by Takema et al. (16). This instrument measures the elastic properties of skin based on the principle of suction

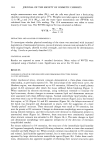
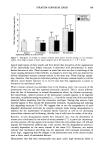
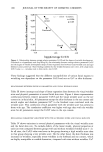
FACIAL WRINKLES 165 elongation, utilizing an optical measuring unit as described by Elsner et al. (13). Briefly, the device consists of a hand-held probe with a central suction head (2 mm in diameter) fitted to a spring that ensures that the head is applied to the skin at constant pressure. It is well known that the major changes of actinic aging in skin take place in the upper dermis regions during the early stage. Due to the small test area (about 3 mm2), we measured the changes in the early stage of actinic aging with a good degree of sensi- tivity. The time/strain mode was used with 8-s application of load: 200 mbar, followed by a 2-s relaxation period. The skin deformation was plotted as a function of time. A typical time/strain recording is illustrated in Figure 1. The parameters used were immediate distention (Ue), measured at 0. ! s, immediate retraction (Ur), and final distention (Uf) as described by Agache et al. (10). All parameters are a function of skin thickness and thus cannot be simply compared between subjects and regions. Each individual measurement of the skin thickness was used to calculate the mechanical parameter values for a given individual for a thickness of ! mm. These normalized parameters were marked with an asterisk (Ue*) as described by Agache et al. (!0). Certain biologically relevant ratios of these parameters, e.g. Ur/Uf, the ratio between immediate retraction and total distention representing the skin's ability to recover its initial position after deformation, have been reported to be independent of skin thick- ness. STATISTICS The results are expressed as means -+ standard deviation. Differences between means were checked for significance using Student's t-test. The influence of age was studied using either analysis of primary correlation coefficient or statistical significance of the Ur Uf Ue 0 -' Vacuum on '• 8 Time (sec) Figure 1. Typical experimental results with the Cutometer on facial skin. A load was applied for eight seconds followed by a two-second relaxation period. The parameters used to describe the deformation are as follows: Ue is the immediate distention, measured at 0. ! s Uv is the delayed distention Ur is the immediate retraction and Uf is the final distention.
Purchased for the exclusive use of nofirst nolast (unknown)
From: SCC Media Library & Resource Center (library.scconline.org)