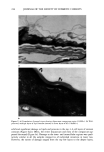
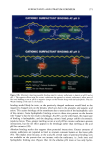
20 MHz B-SCANNING 245 A water-based gel (Cogel, Comedical, Italy) was employed as a coupling medium be- tween the transducer and the skin surface. After acquisition, the echographic images were processed by a program for image analysis (Dermavision 2D, Cortex, Denmark), enabling a numerical description of the images on the basis of segmentation procedures. The instrument, the standardization procedures, and recording conditions have already been described in detail elsewhere (14). For the evaluation of the images, two amplitude intervals were used. The first, ranging from 0 to 30, marks hypo-reflecting areas cor- responding to dermal edema the second, ranging from 201 to 255, highlights hyper- reflecting parts of the skin coinciding with the epidermis and the deep dermis. Statistics. An ANOVA test for repeated values and the SNK test were used to evaluate the differences in respect to baseline. A p value 0.05 was considered significant. Correlation between superficial 201-255 values and capacitance values was calculated according to Pearson. RESULTS Hydration values, as measured by capacitance, showed an increase, in respect to baseline, immediately after patch test removal and for up to 180 minutes after the application of moisturizers 1 and 2 (Table I). Increases in capacitance values were significant at all times of assessment for both moisturizers. When petrolatum was applied, hydration values were significantly higher, with respect to baseline, from 15 to 180 minutes. The evaporation rate, which showed a marked increase at all test areas immediately after patch test removal, dropped to baseline values 30 minutes after application of petrola- tum and 60 minutes after application of moisturizers 1 and 2 (Table II). The increase at removal was higher for moisturizers 1 and 2 in respect to petrolatum. Image analysis on echographic pictures showed that the extension of areas reflecting within the 0-30 interval was significantly higher, with respect to baseline values, at all assessment times, when petrolatum was applied. Although a trend toward an increase in the extension of hypo-echogenic dermal areas was observed also for moisturizers 1 and 2, it was not significant, probably because of the high standard deviations and baseline values (Figure 1). All three products induced an attenuation of the superficial hyper-reflecting band corresponding to the epidermis: superficial 201-255 pixel areas had significantly de- creased at all assessment times after application of the tested products (Figures 2 and 3, Table III). Finally, a significant attenuation of the hyper-reflecting areas of the deep Table I Capacitance Values at Skin Sites Treated With Petrolatum and Two Commercial Products Petrolatum Moisturizer 1 Moisturizer 2 Baseline 48.33 + 5.14 47.53 + 4.81 49.67 + 6.54 Removal 49.87 _+ 6.98 62.13' _+ 11.01 72.2* _+ 10.53 15 min 59.13' -+ 7.02 64.53* _+ 6.3 65.87* _+ 8.69 30 min 60.73* -+ 6.31 62.27* + 7.59 60.47* + 8.42 60 min 57.47 + 6.08 58.93* + 6.41 57.8* _+ 7.49 120 min 55.47* -+ 5.66 55.07* _+ 4.54 53.67* + 7.85 180 min 53.27* -+ 6.62 52.73* + 5.69 52.6* _+ 7.18 * Significant in respect to baseline.

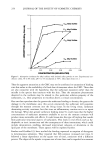
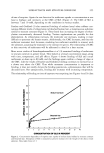
246 JOURNAL OF THE SOCIETY OF COSMETIC CHEMISTS Table II Transepidermal Water Loss at Skin Sites Treated With Petrolatum and Two Commercial Products Petrolatum Moisturizer 1 Moisturizer 2 Baseline 4.4 + 1.45 4.13 + 1.3 4.2 + 1.42 Removal 8.2* _+ 3.38 15.13' _+ 4.58 19.2' _+ 7.35 15 min 5.4* _+ 1.72 6.53* _+ 2.1 7.27* _+ 2.25 30 min 4.4 + 1.64 4.8* + 1.61 4.87* + 1.3 60 min 4.27 + 1.79 4.4 + 1.59 4.67 + 1.59 120 min 3.8 _+ 1.57 4.2 _+ 1.57 4.07 _+ 1.49 180 rain 4.33 + 1.59 4.67 + 1.4 4.53 + 1.46 * Significant in respect to baseline. 0-30 pixels 3000 2800 - 2600 - 2400 - 2200 - 2000 - 1800 - 1600 - 1400 - 1200 - 1000 baseline removal 15' 30' lh 2h 3h • petrolatum • moisturizer 1 • moisturizer 2 Figure 1. Image analysis on echographic pictures. Variation of the extension of dermal areas reflecting within the 0-30 interval. *Significant in respect to baseline values. dermis was observable, for petrolatum, at all assessment times, for moisturizer 1, from 30 to 180 minutes after application, and for moisturizer 2, immediately after patch test removal and from 60 to 180 minutes after application (Figure 4). The correlation coefficient r between superficial 201-255 values and capacitance values was = -0.3519 (p 0.001). DISCUSSION In a study on 12 healthy females, Blichman eta/. studied the effects of a single appli-
Purchased for the exclusive use of nofirst nolast (unknown)
From: SCC Media Library & Resource Center (library.scconline.org)