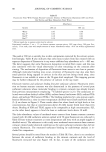
ANIONIC SURFACTANT RINSABILITY 71 EXPERIMENTAL MATERIALS Fluorescein (Figure 1) was purchased from Sigma Chemical Company. Sodium hy- droxide, methanol, triethanolamine, sodium borate, and HC1 were purchased from Fisher Scientific Corp. Sodium dodecyl sulfate (SDS) and sodium laurate (NaL) were purchased from Fluka Chemical Corp. Sodium lauroyl isethionate (SLI CH3(CH2)•oCOOCH2SO•-Na+), 14C-labeled SLI and •4C-labeled SDS were synthesized at Unilever Research. •4•-labeled lauric acid was obtained from Sigma Chemical Co. Potassium hydrogen phthalate and potassium dihydrogen phosphate were obtained from Aldrich Chemical Co. Full-thickness human skin was obtained from the International Institute for the Ad- vancement of Medicine (Exton, Pennsylvania). Stratum corneum was isolated by incu- bating strips of skin, dermis side down, in a solution of 0.5% trypsin in phosphate- buffered saline (PBS) at pH 7.4 for 2•4 hours at 37øC. The dermis was separated from the epidermis using forceps, and the latter was incubated in fresh trypsin-PBS solution overnight at 4øC. The enzyme solution was changed several times until the corneum was separated from the epidermis. The corneum was washed with the PBS solution to remove trypsin and residual cells. The stratum corneum was then spread on spectra mesh to dry overnight under desiccation. Full-thickness porcine back skins from 3-4-week-old white albino piglets were obtained from Buckshire Corp. (Perkasie, PA). The hair from the specimen was clipped and shaved and the underlying subcutaneous tissues were removed. The compositions of three commercial cleansing bars used in this study are given in Table Ia. Bar A has a synthetic surfactant cocoyl isethionate as its main ingredient. Bar B is a high-glycerol triethanolammonium soap composition, while Bar C is a pure soap composition primarily containing sodium salts of tallow (a mixture of stearic and pal- mitic) and coco (primarily lauric) fatty acid. These bars have significantly different mildness characteristics (see Table lb), as evident from their different end-point erythe- ma scores as measured by the flex wash (4), irritation scores as measured by the soap chamber test (19), and zein solubility using the well-established zein dissolution tech- nique (20). /OH Figure 1. Structure of fluorescein.

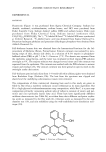
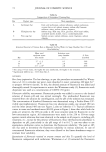
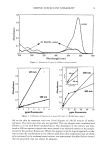
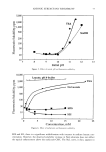
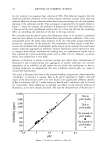
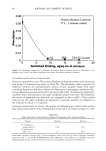
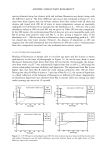
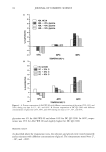
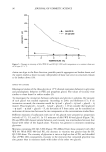
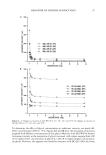
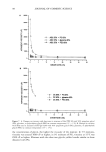
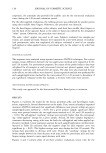
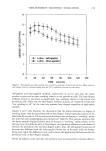
72 JOURNAL OF COSMETIC SCIENCE Table Ia Composition of Formulated Cleaning Bars Bar Product type Main ingredients A Isethionate bar Fatty acid isethionate, sodium tallowate, sodium isethionate, coconut fatty acid, sodium stearate, sodium alkyl benzene sulfonate, water, sodium cocoate, fragrance B Sodium soap, TEA soap, TEA, glycerine, TEA lauryl sulfate, acetylated lanolin alcohol, water, cocodiethanolamide C Sodium cocoate, sodium tallowate, water, fragrance, sodium chloride TEA/glycerine bar Pure soap bar Table lb Irritation Potential of Various Bars as Measured by Flex Wash (3), Soap Chamber Test (19) and Zein Solubility a Mean total Irritation score erythema scores (soap chamber % Zein Bar (flex wash) test) dissolved A 5.7 + 1.2 0.5 59% B 20.4 b 2.8 79% C 27.7 + 2.0 b 2.8 83% Test using 1% bar slurry the higher the zein dissolution, the higher is the irritation. Significantly different (p 0.05) from Bar A. METHODS Bar slurry preparatio,. The bar shavings, as per the procedure recommended by Wortz- man eta/. (2) to simulate tap water, were dissolved in water containing 260 ppm Ca 2+ to prepare 10%(w/v) slurries. To this, the desired amount of fluorescein was added and thoroughly mixed. In experiments to mimic the Wortzman study (2), fluorescein stock dispersion was used at a concentration of 0.005% (50 ppm). Fluorescein solubility measurements. Fluorescein powder was added in excess to the desired solution of known pH and was stirred overnight. The undissolved fluorescein was removed from the solution by centrifugation, and the pH of the solution was measured. The concentration of dissolved fluorescein was determined using a Perkin-Elmer UV- visible spectrophotometer. Fluorescein has two absorption peaks, one around 280 nm and the other around 485 nm (see Figure 2 also see reference 17). Typical calibration curves in water and methanol:water (80:20) given in Figure 3 show that while both the peaks are sensitive, the 485-nm peak is the most sensitive peak for fluorescein in the low-concentration region. All measurements were made in the 250 to 550-nm range against control solutions that were identical to the sample in all respects, including pH, treatment, etc., except for the presence of fluorescein. Since the fluorescein absorbance is dependent on pH, particularly in the pH range of 4 to 8 (17), care was taken to use appropriate calibration curves to determine the fluorescein solubility. The peak at 485 nm was used to determine the fluorescein solubility in various solutions. In case of concentrated fluorescein solutions, they were diluted to the linear absorbance range to estimate their solubility. Quantitation of fluorescein retained on stratum corneum and skin. To quantify the level of fluorescein codeposited with surfactants. Wortzman et al. (2) extracted the fluorescein
Purchased for the exclusive use of nofirst nolast (unknown)
From: SCC Media Library & Resource Center (library.scconline.org)