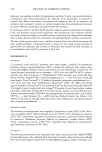
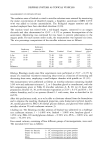
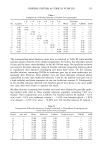
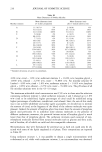
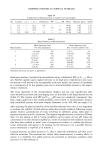
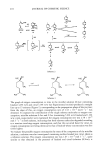
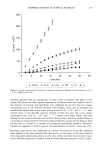
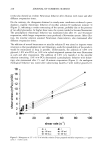
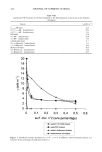
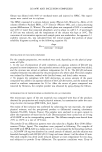
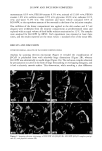
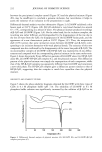
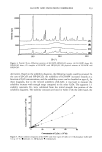
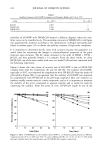
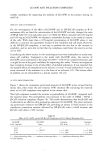
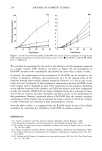
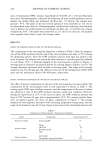
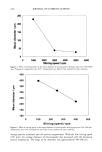
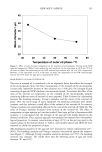
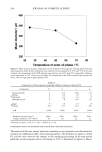
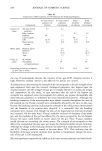
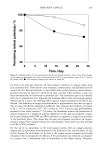
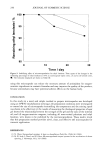
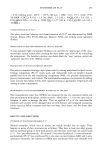
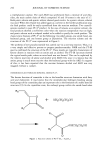
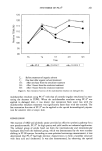
242 JOURNAL OF COSMETIC SCIENCE and a reversed-phase HPLC column, Capcellpak C18 UG-80, 4.6 x 250 mm (Shiseido), were used. Chromatographic conditions for analyzing all trans-retinol palmitate were as follows: the mobile phase was methanol the flow rate, 1.0 ml/min the column tem- perature, 40øC. The peaks of all trans-retinol palmitate were monitored at 325 nm by the photodiode array detector. Chromatographic conditions for analyzing ethyl linoleate were as follows: the mobile phase was methanol the flow rate, 1.0 ml/min the column temperature, 40øC. The peaks were monitored at 215 nm by the detector. All analyses were repeated three times to give the average values. RESULTS EFFECT OF STIRRING SPEED ON SIZE OF THE MICROCAPSULES The composition of the microcapsule dispersion is shown in Table I. Both the tempera- ture of the O/W emulsion mixture and of the outer oil phase were kept at 70øC during the dispersing process. After the O/W emulsion mixture with agar was added to the outer oil phase, the mixture was stirred for three minutes at constant speed and allowed to cool below 30øC. A photomicrograph of the microcapsule is shown in Figure 2. Average particle diameters are plotted against the stirring speed in Figures 3 and 4. The average diameters decreased with increase in stirring speed. The range of the average diameters was 20-200 l•m and 220-400 l•m in the case of the homogenizer (1000-5000 rpm) and the mechanical stirrer (100-400 rpm), respectively. EFFECT OF PROCESS TEMPERATURE ON SIZE OF THE MICROCAPSULES The effect of process temperature on the size of the microcapsules was also studied. The composition of the microcapsules used in this experiment is shown in Table I. The stirring speed (5000 rpm) was kept constant, and the temperature of the outer oil phase was identical to that of the O/W emulsion mixtures under each condition. However, during the experiment at 25øC of the outer oil phase, the O/W emulsion mixture was kept at 50øC because the agar gels at approximately 30øC. The average particle diam- eters are plotted against the outer oil phase temperature in Figure 5. The average diameter of microcapsules decreased with increasing preparation temperature, and the range of the diameters was 28-39 lnm. Figure 6 also depicts the relationship between the Table I Composition of Microcapsules--Preparation Conditions Phase Compounds Concentration (%) Internal oil phase Liquid paraffin 10 Aqueous phase Outer oil phase Water 31 HCO-60 0.5 Butylene glycol 7 Agar 1.5 SC-9450N 0.5 Decamethyl pentacyclosiloxane 49.5

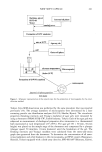
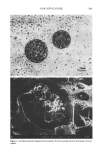
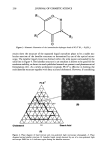
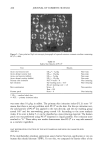
NEW SOFT CAPSULE 243 Figure 2. (a) Optical photomicrograph of microcapsule. (b) Cryo-scanning electron microscopy of micro- capsule.
Purchased for the exclusive use of nofirst nolast (unknown)
From: SCC Media Library & Resource Center (library.scconline.org)