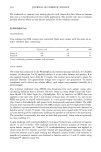
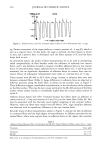
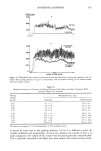
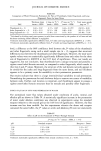
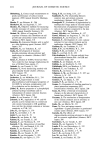
372 JOURNAL OF COSMETIC SCIENCE 140.00 120.00 100.00 8o.oo 60.00 40.00 20.00 0.00 oNail 1A ANail lB ß Nail 2A ß Nail 2B ! i I i 0 4 5 6 7 Time (h) Figure 2. Permeation profile of two toenail pairs (nails A and B from donors 1 and 2). Bars represent SEM (n = 3). Table I Water Permeation Parameters: Normalization of Data for Toenail Thickness Mean + SD Relative standard Parameter (n = 4) deviation (%) Flux J (mg cm-2h -•) 13.58 _+ 5.66 41.68 Normalized flux J* (mg cm •h •) 1.67 _+ 0.35 20.96 Permeability coefficient P (x 102) (cm h -•) 1.37 + 0.57 41.61 Normalized permeability P* (x 10 3) (cm2h •) 1.67 + 0.35 20.96 coefficient nails of Pair 2 result in a statistically significantly higher flux and total water uptake than nails of Pair 1 (t-test, o• = 0.05). The reduced permeation through nails of Pair 1 is partially explained by the fact that this nail pair is thicker (mean thickness = 1.60 + 0.10 mm) than Pair 2 (mean thickness = 1.05 + 0.02 mm). Our results indicate that approximately 88% of the variability in flux is associated with changes in toenail thickness (estimated from the coefficient of determination, i.e., the square of the Pearson product moment correlation coefficient for flux and toenail thickness). This is consistent with reports from the literature wherein permeability coefficients of radiolabeled metha- nol and ethanol were nonlinearly dependent on the reciprocal of fingernail thickness (4). By normalization of the flux and permeability coefficient using equations 1 and 2, the standard deviation was reduced from approximately 42% of the mean value to 21% for both these permeation parameters (Table I). Thus, normalizing the data for nail thick- ness is an effective way to remove one source of interindividual variability between nails. Therefore, we normalized all our data for nail thickness in succeeding experiments.

NAIL PERMEATION 373 The permeation parameters of great toenails and thumbnails are compared in Table II, which shows that these nails differ considerably in thickness, the great toenails being more than twofold thicker than the thumbnails. From the studies with great toenails (described above) it was seen that the thicker nails proved to be more resistant barriers to water permeation, resulting in lower fluxes than was observed with thinner nails. Thus, it was anticipated that the thinner thumbnails would have a higher flux than the thicker toenails. However, Table II shows that although the thumbnails were only about one half as thick as the great toenails, their flux values were not statistically significantly different from each other, and the resulting normalized flux values for thumbnails were statistically significantly lower than the J* values of the great toenails (t-test, tx = 0.05). The coefficient of determination for the correlation between flux and thumbnail thick- ness was 0.13. Our data suggest that toenails and thumbnails differ in structure, thus resulting in different J* values. The total water uptake calculated by dividing the total water extracted from the nails by the product of cell area and nail thickness (assuming lateral diffusion is negligible) is also shown in Table II. The total water uptake by thumbnails was statistically significantly higher than that by toenails (t-test, tx = 0.05). These results further suggest that there is an inherent difference in the structure of the keratin network that comprises the thumbnails and toenails. It appears that the thumb- nails have a tighter cross-linked keratin structure as compared to the great toenails, which results in their almost equal fluxes, smaller J* values, and higher total water uptake. To further elucidate nail permeability characteristics resulting from differences in nail location, we compared J, J*, and total uptake values for water from a pair of thumbnails with those from the index fingernails and long fingernails of the same donor. The results are shown in Table III. The thumbnails were about 1.3-fold thicker than the index or long fingernails, which were close in thickness. As was generally expected, the thicker thumbnails resulted in a statistically significantly (approximately twofold) lower flux (J) for water compared with the other fingernails at the 0.05 level of significance by ANOVA. The index and long fingernails had approximately equal fluxes, possibly due to their similar thickness (68% of the variability in flux was associated with changes in thickness for the other fingernails, as estimated from the coefficient of determination). When the flux values were normalized to account for variation in nail thickness (Table III), the resulting J* values for thumbnails were statistically significantly lower than the J* values for the other fingernails at the 0.1 level of significance by ANOVA. Although not statistically significantly different at the conventionally accepted 95% confidence Table II Comparison of Water Permeation Parameters of Great Toenails and Thumbnails Nail Thickness (mm) J (mg cm-2h -•) J* (mg cm-•h -•) Total water uptake (mean + SEM) (mean + SEM) (mean + SEM) (mg cm-3) c Great toenails (n = 4) a 1.33 + 0.16 13.58 + 2.83 1.67 + 0.18 143.09 + 14.88 Thumbnails (n = 6) b 0.51 + 0.02 13.21 + 1.85 0.66 + O.08t 315.92 + 28.96t a Flux and normalized flux values are the results of three repeated measurements on four great toenails. b Flux and normalized flux values are the results of two repeated measurements on six thumbnails. c Calculated by dividing total water present in nails (from extractions) by the product of cell area and nail thickness (assuming lateral diffusion is negligible). •- Indicates statistically significantly different from parameters for toenails (t-test, o• = 0.05).
Purchased for the exclusive use of nofirst nolast (unknown)
From: SCC Media Library & Resource Center (library.scconline.org)