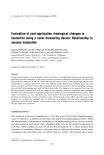
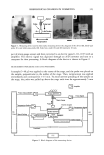
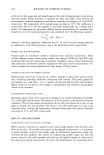
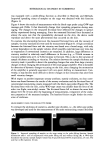
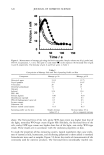
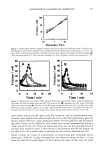
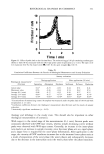
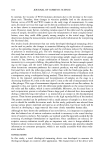
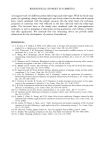
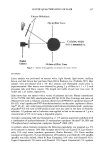
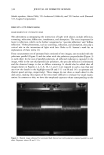
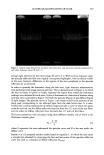
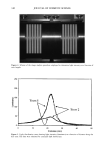
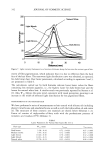
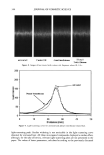
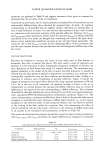
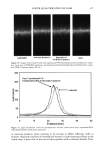
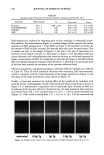
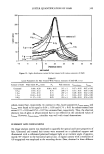
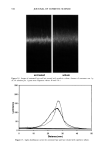
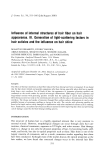
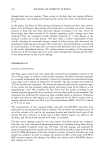
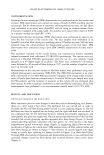
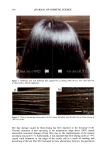
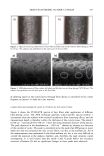
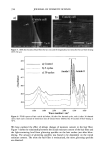
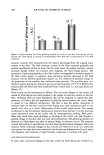
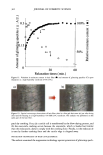
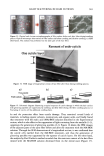
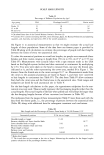
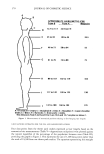
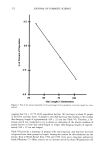
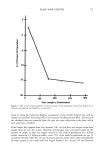
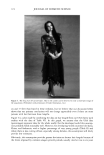
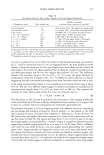
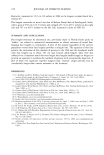
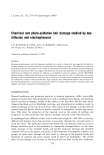
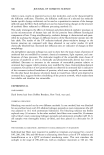
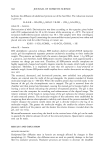
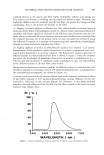
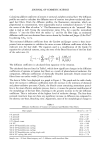
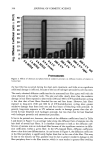
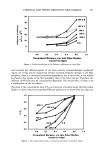
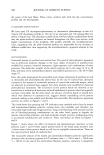
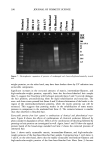
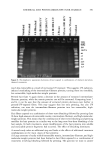
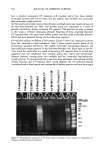
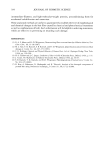
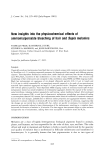
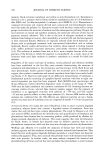
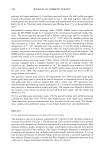
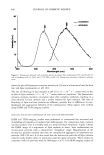
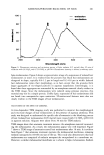
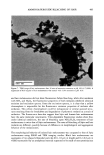
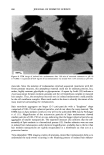
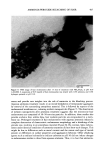
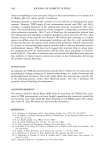
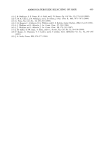
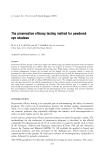
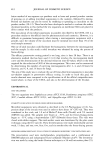
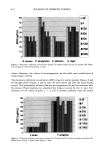
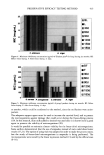
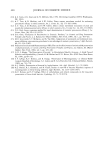
LUSTER QUANTIFICATION OF HAIR 339 Figure 3. Digital image obtained for untreated dark brown hair with polarizers oriented perpendicular to each other. Exposure values: f8 and 1/3 s. average light intensity for the entire image (f8 and 1/3 s). With such an exposure value, the specular reflection falls into slightly overexposed highlights, with no details visible in this area however, differences in the regions of the tress peripheral to the specular reflection are accentuated. In order to quantify the luminance along the hair tress, light intensity measurements were performed with image analysis software. This is demonstrated in Figure 4, in which the four red lines, 50 pixels in width, represent the region from which the luminance readings were obtained for each tress. A plot of luminance as a function of distance along each hair tress is provided in Figure 5 for both the specular (Figure 2) and diffuse (Figure 3) light images. The specular curves in Figure 5 are characterized by the presence of one sharp peak corresponding to the reflected light from the dark brown hair. It is note- worthy that a similar examination of diffuse images provides a curve in which two peaks could be resolved, one for diffuse reflection from the front face (22 mm) of the hair fibers and the other for diffuse reflection from the back face (17 mm) of the fibers. The luster parameters were calculated using three different models, one of which is the Nickerson contrast gloss: S-D No- S (1) where S represents the area underneath the specular curve and D is the area under the diffuse curve. Stamm et al. (2) proposed another model, based on equation 1, in which the area under a straight line obtained by connecting the first and last points of the specular reflection curve was used as a measure of diffuse reflection, Dstamm:

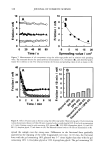
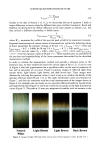
340 JOURNAL OF COSMETIC SCIENCE Figure 4. Scheme of the image analysis procedure employed to determine light intensity as a function of tress length. 250 200 150 100 50 Tress 1 Tress 2 ! ! 1 0 10 20 30 40 50 Distance (rnm) Figure 5. Light distribution curve showing light intensity (luminance) as a function of distance along the hair tress The data were obtained for untreated dark brown hair.
Purchased for the exclusive use of nofirst nolast (unknown)
From: SCC Media Library & Resource Center (library.scconline.org)