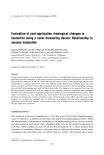
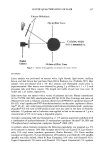
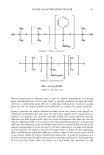
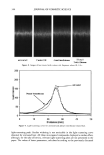
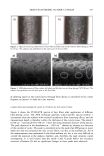
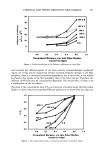
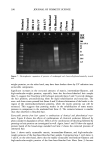
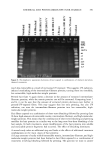
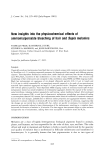
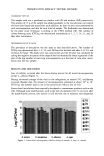
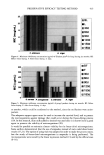
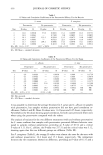
382 JOURNAL OF COSMETIC SCIENCE facilitate the diffusion of solubilized protein out of the hair fiber. The reduction reaction is given as: K-S-S-K + HS-(CH2)4-SH •=• 2 K-SH + (CH2)4-S-S-(CH2) 4 where K = keratin. Derivatization of thiols. Derivatization was done according to the equation given below with 20% iodoacetamide for 30 to 60 minutes while sonicating at -40øC. The ratio of extraction buffer/derivatization solution was 10:1. The samples were then centrifuged, and the supernatant liquid (containing the extracted/derivatized proteins) was taken and placed into new vials for either freezing or instant use. K-SH + I-CH2-CONH 2 • K-S-CH2-CONH 2 + HI where K -- keratin. SDS electrophoretic separation technique. SDS (sodium dodecyl sulfate)-PAGE (polyacryl- amide gel electrophoresis) separates proteins exclusively according to their molecular weight. The proteins are loaded with the anionic detergent SDS, about 1.4 g SDS per 1 g protein, and therefore, build SDS-protein micelle complexes with approximately a constant net charge per mass unit. Therefore, all SDS-protein micelie complexes are highly negatively charged and rapidly migrate towards the anode, which leads to rapid separation. Therefore, it is important to note that this separation is based primarily on molecular weight, because SDS protein micelle complexes have a similar characteristic net charge per mass unit. The extracted, denatured, and derivatized proteins, now unfolded into polypeptide chains, are entered into the wells of the gel alongside the protein standard of known molecular weight (up to -200 kD). When the smallest protein has traveled nearly to the bottom of the gel, the electrophoretic run is stopped. The gel is removed from the chamber and then stained and destained, causing the stained gel to become lighter, but leaving a series of bands indicating the presence of separated proteins. The gel is then scanned into the computer for recording and enhancement of the digital image. The relative intensity of the bands in various lanes of the gel indicates the relative amount of each extracted protein. The molecular weights of the unknowns were established by comparing their relative electrophoretic mobility with those of the protein standard. The relative distance the protein travels down the gel is directly related to the log of its molecular weight. The greater the molecular weight, the smaller the relative electro- phoretic mobility of the protein and the shorter the relative distance traveled down the gel, and vice versa. Microcrofluorometric scans along the bands in the various lanes of the gel can be made to quantify the relative amount of each of the extracted proteins. Quantitative compari- sons can be made. RESULTS AND DISCUSSION MICROFLUOROMETRY Background. Dye diffusion rates in keratin are strongly affected by changes in fiber morphology (3). Therefore, dye diffusion rates are used to quantify damage to the hair fiber by oxidative processes. Oxidative processes are known to decrease the disulfide

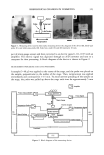
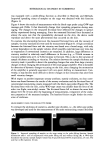
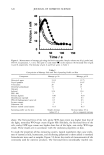
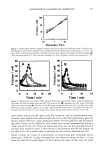
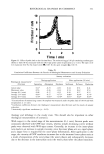
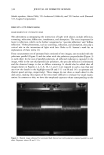
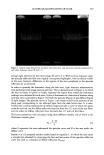
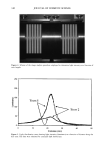
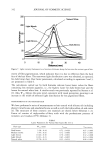
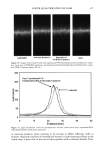
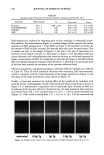
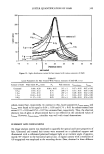
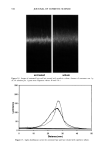
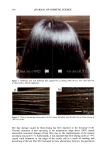
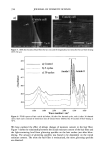
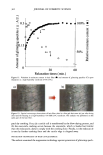
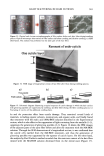
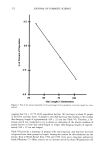
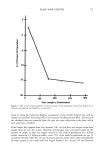
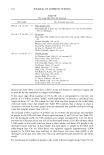
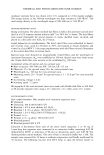
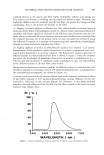
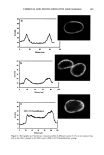
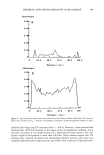
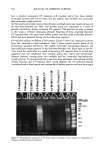
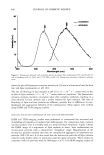
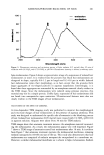
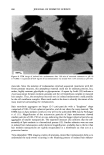
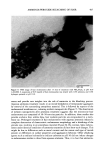
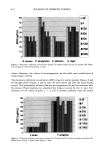
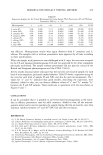
CHEMICAL AND PHOTO-OXIDATIVE HAIR DAMAGE 383 crosslink density in the matrix and form highly hydrophilic sulfonic acid groups (3). This leads to an increase in swelling and increased dye diffusion rates. Therefore, the higher the diffusion rate of a molecule into the hair fiber, the greater the changes in fiber morphology, that is, the greater the damage to the fiber. (a) Mapping of uranine diffusion in bleached hair, Our earlier studies involving chemical oxidation of hair fibers with hydrogen peroxide or a bleach cream containing ammonium persulfate had shown significant increases in the diffusion rates of uranine into the hair shaft, which is indicative of severe chemical and structural modifications resulting from the oxidative processes (2). In the present work, we have extended this method of using the diffusion of uranine as a measure of characterizing and quantifying morphological damage to photo-oxidatively degraded hair fibers. (b) Mapping diffusion of uranine in photochemically oxidized hair. Uranine is an anionic fluorochrome, which produces a green fluorescence in a basic environment and a yel- lowish-green fluorescence in an acidic solution. The fluorescence emission spectrum of diffused uranine in a dyed/unaltered hair fiber is shown in Figure 1. From the emission spectrum, the wavelength of maximum fluorescence of uranine is established at •m = 540 nm, and the instrument is calibrated at that wavelength to carry out the profiling of the diffused uranine in the hair fiber cross section. Representative fluorescence emission profiles of diffused uranine in untreated hair and hair fibers exposed to increasing cycles of UV radiation/humidification, accompanied by the corresponding micrographs, are shown in Figure 2a-c. It can be clearly seen that in the untreated fibers dyed under identical conditions to those of hair fibers exposed to UV radiation/humidification cycling, diffusion of the dye molecule is restricted to the cuticula (Figure 2a). However, in the photo-oxidized samples, increased diffusion of the dyestuff into the fiber interior occurs with increased exposure time (Figure 2b,c). FI(%) 100 - 8O 6O 4O 2O o 360 460 ß liB'" ' ' i ..... I' ' ! ,560 660 760 WAVELENGTH (nm ) Figure 1. Typical fluorescence emission spectrum of uranine in an untreated hair tiber.
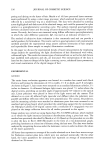
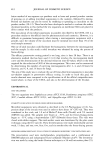
Purchased for the exclusive use of nofirst nolast (unknown)
From: SCC Media Library & Resource Center (library.scconline.org)