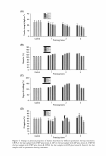
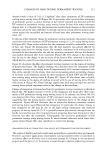
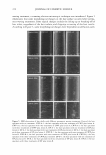
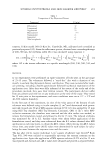
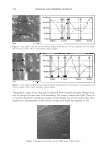
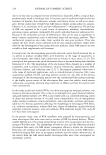
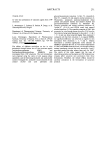
AFM IN PARTICLE CHARACTERIZATION 227 and date were recorded in permanent marker. The replica samples were examined with both SEM and AFM. We used variable-pressure SEM 5136 LSU (Tescan) for the SEM study of the topography of the skin replicas. No special preparation for the replicas was applied. The variable pressure capabilities of this machine precluded specimen coating with conductive materials such as with conventional SEM. Images were taken at 20 kV, and the chamber pressure was maintained at 30 Pa. BI-MODAL SUSPENSION SPECIMEN The polymer nanoparricle mixture was prepared by mixing mono-modal suspensions in a ratio of 1: 1 by volume. NIST-traceable polymer nanospheres (Duke Scientific, Inc) with certified nominal diameters of 102±3 nm and 21 ± 1.5 nm were used. The standard deviation of the distribution for 102-nm spheres was 4.4%. The standard deviation of the distribution for 21-nm spheres was not specified. The AFM specimens were prepared by spin coating the solution on Nanoflat™ substrates and placed in an EClOl spin coater (Headway Research Inc.). Diluted solutions were deposited on the substrate and allowed to sit for 30 seconds prior to spin coating at 2000 rpm for 30 seconds. The solutions were characterized by AFM. The water suspension mixture was characterized by DLS (Wyatt Technologies Inc). All AFM data shown in this paper were obtained using a Light Lever Nano-Rp™ AFM (Pacific Nanotechnology Inc.) and analyzed with NanRule+ TM image analysis software. Nanoflat™ substrates were used for the sample preparation. The vibrating mode or close contact mode with a Si probe (Applied Nanostructure Inc.) was used for imaging. RESULTS AND DISCUSSION APPLICATION TO REPLICA EVALUATION (ANTI-WRINKLE TREATMENT) The example of the 3D visualization of the replica surface roughness is shown in Figure 1. The height profile data (Figures 2 and 3) show that the RMS surface was 48 nm at baseline and 25 nm after eight weeks of treatment. In the case of line-depth measure ments, the depth was 145 nm, 132 nm, and 115 nm at baseline, and the corresponding areas measured 85 nm, 72 nm, and 56 nm after eight weeks of treatment. Both depth and surface roughness were greater at baseline than after treatment. 5"an D.Utance IZ3, UJlldl Z D.Utance (655.ZSIIID! i 655,25m 327,63 ... f Z 0.00 ... ez, DistMC:e (17,11?1 z :01atllft011: (494 .eoma, i 484.80""' 242.40mn o.oo ... Figure 1. 3D AFM image (24 x 24 microns) of pretreatment replica (left). 3D AFM image (17 x 1 7 microns) of posttrearment replica (right).

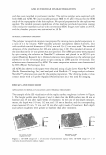
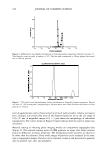
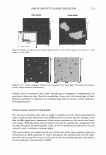
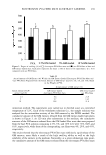
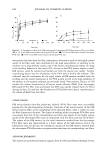
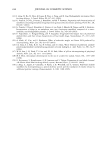
228 Oµm JOURNAL OF COSMETIC SCIENCE 294.9Qnmr------"""T'"..,...--------,.,-:-------:-:-. r"-', : 3 1 I 148.76nm -------- I I -----P----�-- •-- 1 I 2.53nm_________....._..______________. 0.001,1m 2.12µm 4.25µm 6.37µm 6. 37µ.m. 1 ....._ _______________________ ___, Figure 2. Line profile with the cursors showing height measurements: 145 nm (squares), 132 nm (dots), and 115 nm (crosses). This is pretreatment replica sample. 2.49nm1,,,;;1� --.:....- ....;: ;.... _____ ..:.... ____ z.......1 O.OD1,.1m 2.13µm 4.26µm El.391,1m Figure 3. Line profile with the cursors showing height measurements: 85 nm (dots), 72 nm (squares), and 56 nm (crosses). This is after treatment replica sample. Topographic images of the skin replicas obtained with secondary electrons (Figure 4) are easy to interpret because they look remarkably like images viewed with light. They can be used for qualitative comparison analysis of the samples but are not useful when exact quantitative measurements of the feature's height and depth are required (5,14). Figure 4. Example of secondary electron SEM image of skin replica.
Purchased for the exclusive use of nofirst nolast (unknown)
From: SCC Media Library & Resource Center (library.scconline.org)