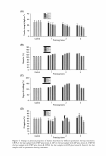
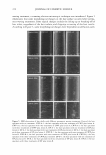
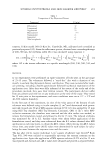
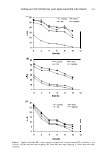
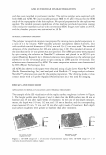
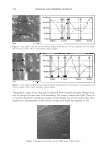
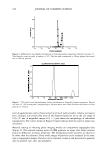
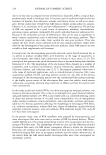
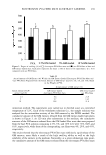
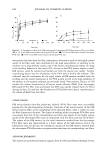
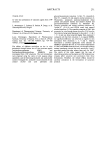
AFM IN PARTICLE CHARACTERIZATION 229 AFM analysis shows that the local surface roughness is greater for the pretreated sample, 48 nm vs 25 nm RMS. It implies that the possibility of antiwrinkle treatment has been successful and, even more important, can be quantified. Nanoscale surface evaluation is critical because the skin is easier to treat during the early stage of aging. More aggressive methodology is needed to confront micron- or millimeter-size wrinkles. Optical pro filometry has capabilities to evaluate surface topography on a micron-centimeter scale, while AFM covers the micron to nanometer range. To be conclusive on treatment results, larger experiments involving complementary topography techniques are nessesary. APPLICATION TO PARTICLE SUSPENSION (SKIN AND HAIR CARE) Figure 5 shows both a topographic image and height profile measurements of the bi-modal mixture of polymer nanoparticles. Height measurements indicate particles on the order of 20 nm and 100 nm, which are consistent with the nominal diameters specified by the vendor. The exact measurements of the particle height on the line profile are 17 .9 nm and 95 .6 nm. Figure 6 illustrates the particle height (size) distribution (PSD) obtained on six AFM scans of different scales. The total particle count included in the analysis is 505. The resolution of the peaks can be clearly seen to be better than that of DLS (Figure 7). The DLS measurements correspond to a hydrodynamic radius of 122.5 nm or a 245-nm diameter. The second peak corresponds to some objects of about 100 µm in radius. We believe this artifact is due to the presence of large dust particles. The AFM ensemble reported data indicate two peaks present, with the average size for the smaller size -25 nm, and for the larger size -95 nm. The AFM resolution of the PSD for bi-modal distribution can be estimated as -5 + 10 nm. Both Figures 6 and 7 show that AFM is capable of resolving complex distributions and reporting accurate particle dimensions. Comparative AFM/DLS data demonstrate that AFM is capable of resolving bi-modal distribution of nanoparticle suspension, while DLS lacks the required resolution below 100 nm. The significance of being able to characterize the complex PSD of suspensions and formulations results from the phenomena of stability. The narrower PSD of the formulation can be controlled, and the formulation is more stable. APPLICATION TO POWDER PARTICLES Figure 8 shows a foundation powder deposited on the gl-substrate™. Particles and 105.22nm------•.- .... -----,.-..--....--. 21 78.91nm 29.30nm : : M 1· I I I l ••••••••••►•• •••••••••.. *• •••••• •w•• t ' . . l I • f 1 I --··------�-- -------·-----# --··-- --·· I t f t f I ' . t ··········�-· - -----·�--:---• . ' t • I Figure 5. Topographic image (2.9 x 2.9 microns) of polymer nanoparticles showing presence of small and large nanoparticles, 18-nm spheres and 95-nm spheres, respectively.

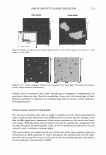
230 JOURNAL OF COSMETIC SCIENCE Particle helght(nm) Figure 6. AFM particle size (height) distribution of bi-modal polymer suspension. Particle size ratio 5:1. Total particle count included in analysis is 505. The first peak corresponds to 20-nm spheres, the second one to 100-nm particles. log differential hydrodynamic radius 2.5 Figure 7. DLS particle size (hydrodynamic radius) distribution of bi-modal polymer suspension. Particle size ratio 5:1. The second peak, corresponding to 100-µm radius, most likely indicates the presence of dust particles in solution. particle agglomerates can be characterized in terms of radius, height, volume, and aspect ratio. A larger scan reveals that most of the deposited particles are in the size range of 103-31 7 nm. A magnified image of (3 x 3 µm) shows the morphology of individual nanoparticles. The circles shown in Figure 8 (right) indicate how the particle radius was calculated. Material sensing or vibrating phase imaging modes can complement topography data (Figure 9). The material sensing mode of AFM produces an image that shows contrast based on differences in elastic properties. The foundation powder particles are shown to be softer than the substrate. Phase mode images of particles can be analyzed in the same way as topography images. Particles can be outlined, counted, and measured to generate data on particle size, area, and perimeter.
Purchased for the exclusive use of nofirst nolast (unknown)
From: SCC Media Library & Resource Center (library.scconline.org)