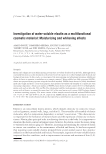
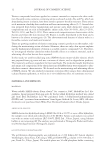
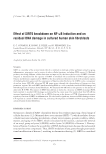
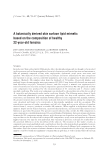
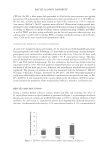
J. Cosmet. Sci., 68, 55–58 ( January/February 2017) 55 An in vivo confocal Raman spectroscopic investigation of salicylic acid penetration: Variation with formulation parameters MARK A. DAVIES, Consumer Science, Ashland Specialty Ingredients. Abstract Salicylic acid (SA) is widely used in leave-on antiacne formulations, typically at a 2% level. As a β-hydroxy acid, it is a milder active ingredient than either α-hydroxy acids or benzoyl peroxide. SA is a keratolytic agent, a bacteriocide, and a comedolytic agent. For these reasons, improving the effi ciency of SA delivery is of interest. The objective of this work is to measure in vivo SA penetration from topically applied 2% SA leave-on products and to understand the penetration in terms of formulation parameters. Penetration of SA was measured in three depth zones—0–3 μm, 3–6 μm, and 6–9 μm below the surface—using in vivo confocal Raman spectroscopy. The delivery of SA from an emulsion, pH 4.0, and a hydrogel, pH 3.75, was compared and contrasted. A comparison of depth profi les reveals, e.g., signifi cant differences in SA distribution between-treatment profi les at various time points after treatment, particularly 3–6 μm below the surface. The hydrogel exhibited the higher normalized level of SA in the 3–6 μm depth zone. Confocal in vivo Raman spectroscopy is proving to be a valuable tool in determination of details of penetration of products into the skin. The penetration of various 2% SA anti-acne product forms will be compared and contrasted in this presentation. Delivery of SA will be discussed in terms of formulation parameters such as phase, pH, and specifi c ingredients and molecular-level interactions. INTRODUCTION Salicylic acid (SA) is a widely used active ingredient in antiacne products. It serves several functions—as a keratolytic agent, as a comedolytic agent, and as a bacteriocide. It is a β-hydroxy acid and is milder than α-hydroxy acids or benzoyl peroxide. Nevertheless, it can be irritating at a pH of 3–4, the pH range at which SA is most effi cacious in treat- ment of skin disease (1). One tactic for decreasing the irritation potential of SA is to control its delivery into the skin. The delivery of SA into the skin can be affected by formulation parameters (2). A major difference in the formulae tested here is the amount of ethanol and the matrix containing SA. Ethanol is known to be a skin penetration enhancer and is used in many transdermal formulae and patches. It can accomplish this function by several means. Ethanol may act as a solvent for the active of interest. In addition, it can aid in optimizing the solubility Address all correspondence to Mark Davies at MADavies@ashland.com.

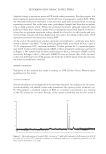
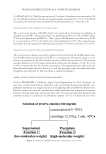
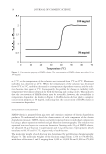
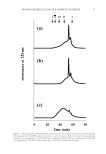
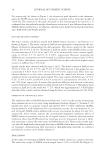
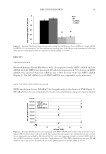
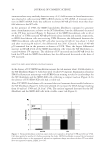
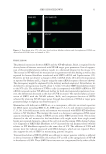
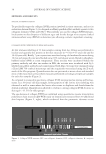
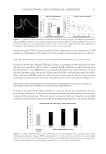
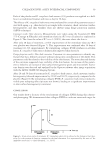
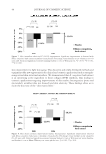
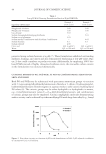
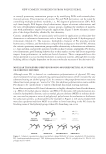
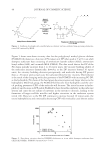
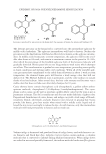
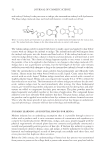
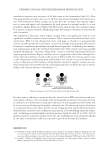
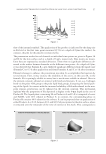
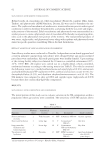
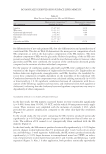
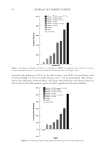
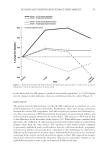
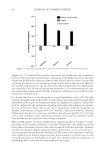
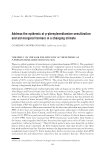
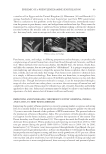
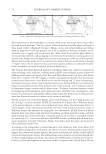
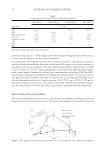
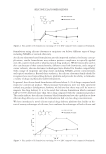
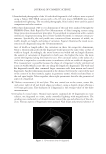
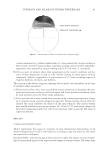
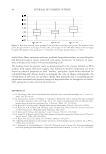
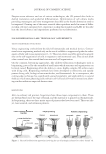
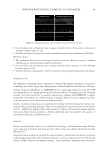
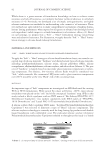
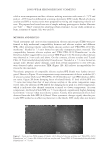
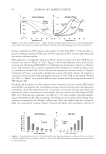
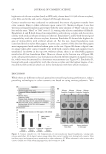
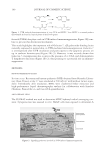
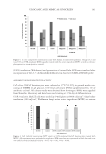
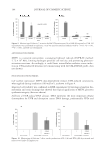
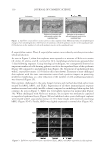
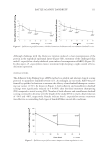
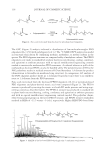
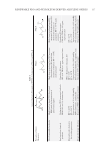
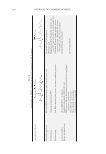
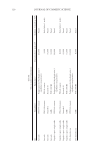
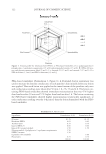
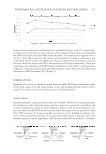
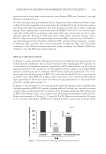
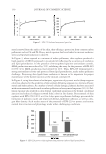
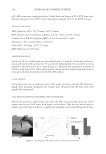
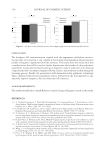
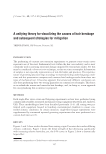
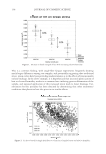
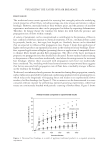
JOURNAL OF COSMETIC SCIENCE 56 of actives in the stratum corneum. Specifi c interactions between SA and the matrix may also be important. MATERIALS AND METHODS Volunteers signed informed consent before participation. All formulae tested contained 2% SA. Products tested included a treatment cream (Prod- uct A), an alcohol-based gel cream (Product B), and a liquid toner (Product C). Eight microliters of either Product A or B was used. In the case of liquid Product C, 20 μl was used. These dosages resulted in a total deposition of SA at the surface of Product A (0.12 mg/cm2) and Product B (0.11 mg/cm2), and, for the liquids (Product C), 0.14 mg/cm2. Spectra were acquired using a RiverD gen2-SCA in vivo confocal Raman spectrometer, equipped with a 785-nm laser source. Laser power was 20 mW. The acquisition time for each spectrum was 5 s. The step size for depth profi les was 2 (Product C) or 3 μm (Prod- ucts A and B). Each depth profi le was recorded in triplicate at each time point and aver- aged for each volunteer (see below). DATA ANALYSIS Normalized intensities as illustrated in Figure 2A and B were calculated by dividing a peak area of an SA band by an internal intensity standard. SA exhibits an aromatic ring- breathing mode near 1040 cm-1. This spectral feature was chosen because it is not shifted by the ionization state of SA and is sharp, intense, and well defi ned. Internal intensity standards are used to compensate for differences in intensity arising from experimental variables such as laser power, optical contact, and skin tone. One of these, used for For- mulae A and B, is the ring-breathing mode of phenylalanine at 1000 cm-1. The second, used to evaluate the liquid astringent Formula C, is the protein Amide I mode near 1650 cm-1. The use of Amide I for Formula C was preferred due to a spectral overlap of ingredients with the phenylalanine band. To estimate the fraction of SA present in a given depth, the differences of the above ratios from the corresponding ratio at baseline were fi rst calculated at each depth and time point. As depth profi les were recorded in triplicate, the baseline ratios were averaged before the differences from baseline were calculated. The differences from baseline for each time point and depth was averaged across volunteers. For a given depth profi le, the differences from baseline were summed over the depths sampled. The sum represents all SA. The fraction of SA at a given depth was then the ratio of the dif- ference from baseline at a given depth to the sum of differences from baseline. Analysis of variance was used to establish statistical signifi cance (Minitab™, Minitab, Inc., State College, PA). RESULTS AND DISCUSSION A representative in vivo Raman penetration profi le is shown in Figure 1. The responses of the band ratio of the SA band to that of Phe are shown in Figure 2A and B for a placebo and a SA-containing formula, respectively. The ratios are mapped out by the response surfaces, for which the x is depth, y time, and z the ratio of the SA band to
Purchased for the exclusive use of nofirst nolast (unknown)
From: SCC Media Library & Resource Center (library.scconline.org)