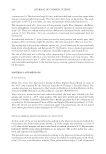
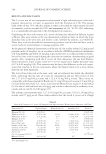
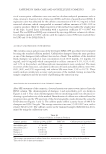
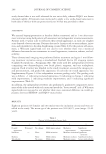
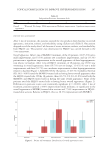
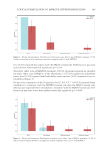
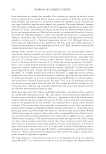
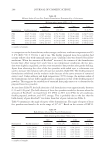
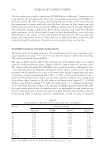
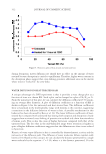
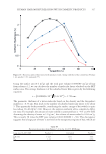
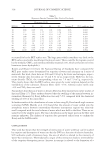
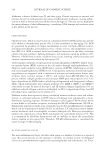
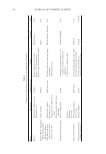
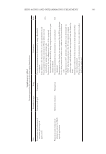
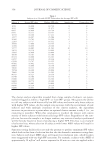
JOURNAL OF COSMETIC SCIENCE 258 pH 7–8. In this weakly alkaline solution, carbomer was precipitated as a white solid clod which was further separated by centrifugation (22). OPTIMIZATION OF SPE PROCE DURE Optimization of the SPE p rocedure included cartridge and solvent selection, as well as extraction recovery evaluation. Caffeine is soluble in methanol therefore, this solvent was selected for elution. The cartridge was selected based on the extraction yields obtained for standard solutions and real samples on each type of the tested sorbents. A known amount of caffeine standard solution, at three different concentration levels (0.01 mg/mL, 0.02 mg/mL, and 0.1 mg/mL) which corresponded to caffeine content of 0.02%, 0.04%, and 0.2% in cosmetic product was extracted on different cartridges, and the extraction yield was calculated as the ratio of the loaded and eluted caffeine. The percentage extraction yield was found to be 84–90% for HR-X cartridges, whereas for the other types of car- tridges, these values were lower. Thus, for examined cartridges, recoveries were 70–77% on C18, 68–75% on C18ec, 75–86% on C18 Hydra, and 80–90% on C8. However, the fi nal cartridge selection also depended on the sample matrix therefore, the extraction yield test was made for all real samples on fi ve cartridges. Also, the chromatographic parame- ters obtained for these extracts were analyzed. The results showed that the highest chro- matographic peak purity, peak area, and concentrations of caffeine from all real samples except hair balsam were obtained on HR-X cartridges. The octadecyl modifi ed silica endcapped cartridge (C18ec) was eliminated because an opalescent solution was obtained after eluting with methanol. Also, some ingredients of the viscous shampoos clogged C18ec and C18 cartridges, and the fl ow of the sample was diffi cult. A similar situation was found for the hair balsam extraction on C18ec, C18, and C18 Hydra cartridges. In Table II, chromatographic peak areas obtained for the examined cosmetics on different cartridges were presented. An HR-X cartridge was selected for the extraction and clean-up because it allows fast sample fl ow and high extraction yields. Only for hair balsam, the C8 car- tridge was used because of a signifi cantly higher peak area for caffeine. ANALYTICAL PARAMETERS The calibration line for caffeine determination was constructed by plotting the peak areas versus the concentration of the standard solution. A least-squares linear regression analy- Table II Average Caffeine Peak Area Obtained on Different Cartridges Product Peak areas ± SDa HR-X C18 Hydra C8 Anticellulite gel 1 2,702.7 ± 75.4 715.6 ± 46.1 594.9 ± 42.8 Anticellulite gel 2 1,195.2 ± 80.3 442.1 ± 52.7 180.6 ± 20.6 Shampoo 1 1858.5 ± 182.6 911.4 ± 38.4 450.3 ± 40.9 Shampoo 2 1772.0 ± 130.4 1730.8 ± 105.9 604.9 ± 51.4 Hair balsam 1,375.1 ± 95.2 – 1748.2 ± 78.5 a SD of three measurements .

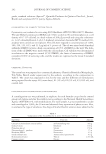
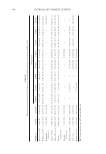
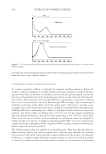
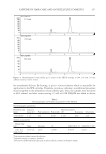
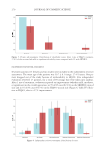
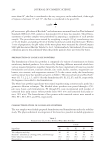
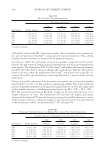
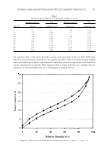
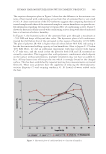
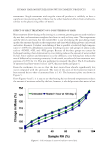
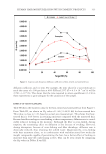
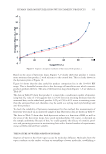
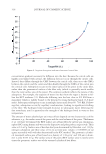
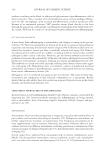
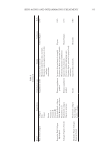
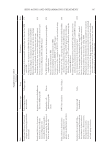
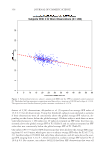
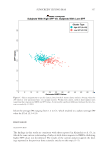
CAFFEINE IN HAIR-CARE AND ANTICELLULITE COSMETICS 259 sis of a seven-point calibration curve was used to calculate analytical parameters such as slope, intercept, linearity, limit of detection (LOD), and limit of quantifi cation (LOQ). A regression curve was obtained for the caffeine concentration of 0.01–0.2 mg/mL in fi nal extracted solutions, which corresponded to assumed caffeine amounts of 0.08–1.6% in cosmetic products (Table I). High sensitivity of the method was enabled by a high value of the slope. A good linear relationship with a regression coeffi cient R2 = 0.9997 was found. The real LOD and LOQ were estimated by injecting different volumes of caffeine- free shampoo spiked to 0.08% caffeine until the signal-to-noise (S/N) ratio reached three for LOD and 10 for LOQ (Table I). ACCURACY AND PRECISION OF THE METHOD The overall accuracy and precision of the developed HPLC-SPE procedure were estimated by using the standard addition method. Caffeine-free shampoo (from the same producer as one of the shampoos with caffeine) was used as a blank. Ten millilitre of the dissolved blank shampoo was spiked at four concentration levels (0.05 mg/mL, 0.1 mg/mL, 0.2 mg/mL, and 0.6 mg/mL) which corresponded to caffeine content of 0.1%, 0.2%, 0.4%, and 1.2% in the product, and three replicate measurements were conducted. The mean recoveries of the extraction, calculated as the ratio of found and added caffeine, were 78%, 85%, 90%, and 97% respectively, and relative SDs were from 3.5% to 10.7%. These results indicate satisfactory accuracy and precision of the method, having in mind the sample complexity and the necessity of performing the extraction step. APPLICATION OF THE METHOD TO THE COSMETIC SAMPLES After SPE treatment of th e cosmetics, clear and nonviscous extracts were injected into the HPLC column. The chromatograms of shampoo 1 and anticellulite gel 1 are shown in Figures 2 and 4. Very clean chromatograms with no interfering peaks were obtained, in- dicating a good selectivity of the method. Identifi cation of caffeine was achieved based on retention times and by UV spectrum of the chromatographic peaks obtained by using the DAD detector (Figures 3 and 5). The caffeine peaks exhibit a purity factor of 989.6 for shampoos and 999.2 for gels. The average retention time was 3.34 ± 0.007 min, with a relative SD of 0.21%. The caffeine content in the examined samples (Table III) was deter- mined by using the calibration curve. Table III Content of Caffeine in Cosmetic Products Cosmetic product Caffeine (g/100 g ± SD)a RSDb (%) Caffeine percent in products (%) Anticellulite gel 1 1.7 ± 0.05 2.9 1.7 Anticellulite gel 2 0.73 ± 0.05 6.9 0.73 Shampoo 1 1.08 ± 0.1 9.3 1.08 Shampoo 2 1.04 ± 0.08 7.7 1.04 Hair balsam 1.0 ± 0.07 7.0 1.0 a The average concentration of caffeine from three measurements expressed per 100 g of the products . b The relative SD of three measurements .
Purchased for the exclusive use of nofirst nolast (unknown)
From: SCC Media Library & Resource Center (library.scconline.org)