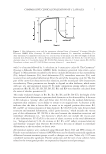
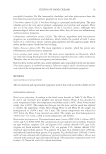
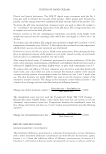
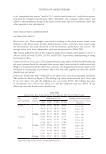
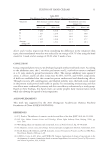
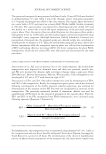
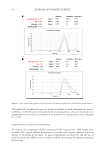
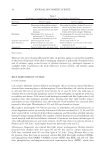
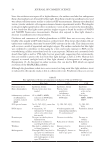
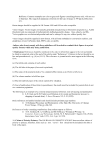
7 COMPARATIVE CLINICAL EVALUATION OF C LAPPACEA with 5 s of suction followed by 3 s of release in 3 consecutive cycles (8). The Cutometer® (Courage + Khazaka Electronic GMBH, Köln, Germany) generated time-strain curves (Figure 1). Measurements recorded by the device include deformation or skin extensibility (Ue), delayed distension (Uv), final deformation (Uf), immediate retraction (Ur), total recovery (Ua), and residual deformation (R) at the end of the measuring cycle (9). The first part of the curve (Ue) characterizes skin elasticity, and the second part (Uv) characterizes viscoelasticity. These parameters are thought to depend on skin thickness, which varies with age, sex, and anatomical region (9). To make comparisons among subjects, relative parameters (R0, R1, R2, R3, R4, R5, R6, R7, R8, and R9) were therefore calculated from the ratios of absolute parameters (9). This study evaluated changes in R0, R1, R2, R5, R6, and R7. R0 (Uf), the height of the first maximal skin deformation, represents final distension or skin distensibility. A decrease in R0 indicates a “tensing” effect and firmer skin. R1 (Uf–Ua), the residual deformation, represents skin resilience, or its ability to return to its original state. A decrease in R1 indicates that the skin is better able to revert to its original position after stress. R2, R5, and R7 are various measures of skin elasticity. R2 (Ua/Uf) is the ratio between final retraction and maximal deformation, called “gross elasticity,” which includes the viscous part of skin deformation. R5 (Ur/Ue) is the ratio between the immediate retraction and immediate deformation (i.e., “net elasticity”), which does not include the viscous part of skin deformation. R7 (Ur/Uf) is the ratio of elastic recovery to the total deformation (i.e., “biological elasticity”) (9). An increase in R2, R5, or R7 reflects increased elasticity and therefore “younger” skin (8,10,11). R6 (Uv/Ue) is the ratio of delayed to immediate deformation, or the viscoelastic to elastic ratio. All statistical analyses were conducted using Microsoft Excel 2010 and SPSS version 22. Paired t-tests and analyses of variance (ANOVAs) were used to identify statistically significant differences between treatment groups as well as changes over time. Values of p 0.05 were considered statistically significant. Patient satisfaction and the rate of any adverse events related to the investigated product are expressed as frequencies and percentages. Figure 1. Skin deformation curve and the parameters obtained from a Cutometer® (Courage + Khazaka Electronic GMBH, Köln, Germany). Uf: final deformation (firmness), Ue: immediate extensibility, Uv: delay distension, Ur: immediate retraction, Ua: total recovery of the initial state, R0: (Uf) Hight of the first maximal skin deformation, R1: (Uf–Ua) Residual deformation (the smaller, the better), R2: (Ua/Uf) Gross elasticity (closer to 1 = perfectly elastic), R5: (Ur/Ue) Net elasticity (closer to 1 = more elastic), R6: (Uv/Ue) Viscoelastic to elastic ratio, R7: (Ur/Uf) Elastic recovery (closer to 1 = more elastic).

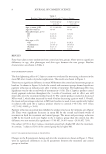
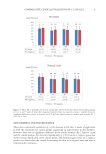
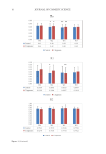
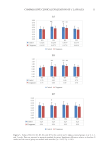
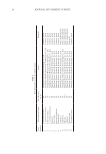
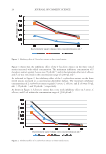
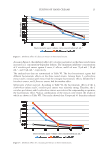
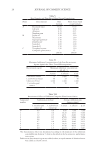
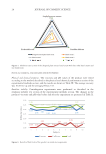
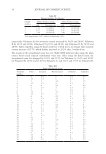
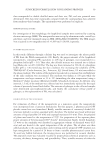
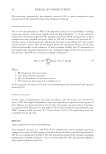
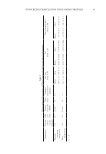
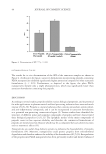
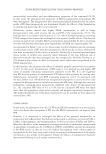
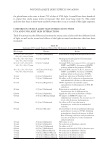
8 JOURNAL OF COSMETIC SCIENCE RESULTS Forty-four subjects were randomized into control and test groups. There were no significant differences in age, skin phototypes and skin type between the two groups. Baseline characteristics are shown in Table I. SKIN LIGHTENING EFFECT The skin lightening effect of C lappacea cream was evaluated by measuring a decrease in the mean MI after 4 weeks of product application. The results are shown in Figure 2. There was no significant difference in mean MI between the control and treatment groups at baseline. As shown in Figure 2a, both the control and treatment groups showed significant pigment reduction in melasma sites after 4 weeks of treatment. The lightening effect was significant even by the second week of treatment (p 0.01). The C lappacea product caused steady pigment reduction throughout the 4 weeks of treatment, and its effect was still observable after the treatment finished (week 5). The control product resulted in decreased MI at week 2, which then increased by week 4 before decreasing again to week 5. Overall, the mean and percentage reduction in MI from baseline to week 4 were significantly higher in subjects who used the C lappacea product relative to controls (–36.5 AU, 12% versus –13.73 AU, 4.68% p 0.05). Pigment reduction in normal skin exhibited a similar trend as in the melasma area (Figure 2b). There were significant decreases in mean MI by the second and fourth weeks of treatment in both the treatment and control groups. The mean and percentage reduction in MI by the fourth week were higher in the C lappacea group than the control, but this difference was not statistically significant (–37.09 AU, 14.6% versus –20.59 AU, 7.9%). One subject (4.5%) in the C lappacea treatment group had a higher MI after the treatment. In contrast, 7 subjects (32%) in the control group had a higher MI. EFFECT ON SKIN BIOMECHANICAL PROPERTIES Changes in the R parameters during and after the treatment are shown in Figure 3. There were no significant differences in any R parameters between the treatment and control groups at baseline. Table I Baseline Characteristics of Control and C lappacea Groups Control group (n=22) C lappacea group (n=22) Age, y, mean ± SD 45.22 (±6.68) 46.62 (±6.12) Age min–max (y) 30–54 33–55 Skin phototypes, n (%) III 3 (13.6) 7 (31.8) IV 8 (36.4) 9 (41) V 11 (50) 6 (27.2) Skin type, n (%) Oily 2 (9.1) 4 (18.2) Combination 13 (59.1) 10 (45.5) Normal 6 (27.3) 7 (31.8) Dry 1 (4.5) 1 (4.5)
Purchased for the exclusive use of nofirst nolast (unknown)
From: SCC Media Library & Resource Center (library.scconline.org)