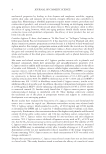
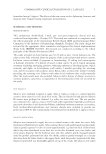
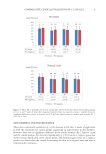
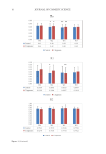
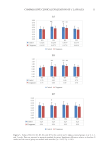
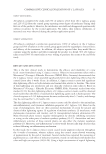
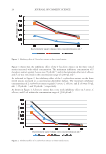
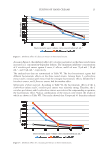
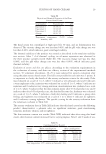
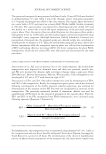
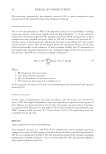
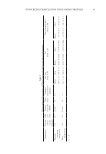
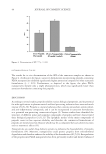
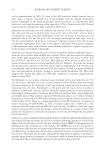
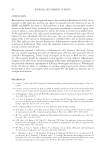
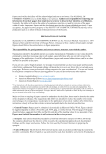
11 COMPARATIVE CLINICAL EVALUATION OF C LAPPACEA Figure 3. Values of R0, R1, R2, R5, R6, and R7 for the control and C lappacea-treated groups in at 0, 2, 4, and 5 weeks. Data are reported as means ± standard deviation. Significant differences relative to baseline (0 weeks) and the control group are marked with asterisks (*p 0.05, **p 0.01).

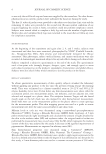
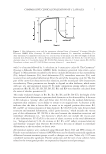
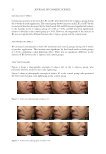
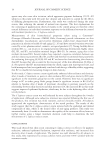
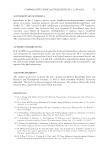
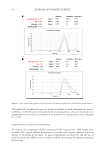
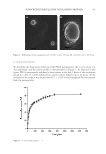
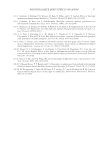
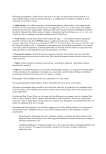
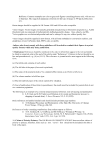
12 JOURNAL OF COSMETIC SCIENCE SKIN ELASTICITY EFFECT Continuous increases in the mean R2, R5, and R7 were observed in the C lappacea group during the 4 weeks of cream application. The control group showed increases in R2, R5, and R7 by the second week but then decreased by the fourth week. R2 and R5 increased significantly relative to the baseline in the C lappacea group (p 0.05, p 0.01), and R5 increased significantly relative to baseline in the control group (p 0.01). However, the magnitude of the increase in R5 was not significantly different between the C lappacea group and the control group. SKIN HYDRATING EFFECT R6 increased continuously in both the treatment and control groups during the 4 weeks of product application. This increase was significant by the fourth week in both groups (p 0.01), confirming a skin hydrating effect. There was no significant difference in the increase of R6 between the C lappacea and control groups. VISIA® PHOTOGRAPHS Figure 4 shows a photographic example of subject #43 in the C lappacea group, who presented the best result for skin color lightening. Figure 5 shows a photographic example of subject #5 in the control group, who presented the best result for skin color lightening in the control group. Figure 4. Times-series photographs of subject #43. Figure 5. Time-series photographs of subject #5.
Purchased for the exclusive use of nofirst nolast (unknown)
From: SCC Media Library & Resource Center (library.scconline.org)