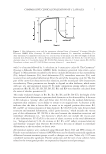
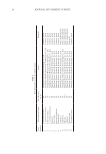
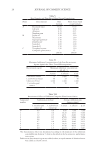
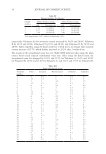
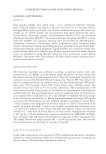
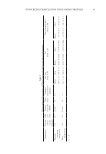
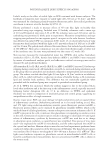
Table I Physicochemical Characteristics of PLGA Nanoparticles Before and After Lyophilization Formulation Polymer concen- tration (mg/mL) PVA 2% (mL) Homog- enizer rate (RPM) Time (min) Galangin concentration (mg/mL) Size (nm) mean ± SD PdI mean ± SD Zeta potential (mV) mean ± SD Propolis- containing nanoparticle 33.3 10 15,000 15 5.3 Before After Before After Before After 263 ± 13 381 ± 11 0.381 ± 0.025 0.379 ± 0.021 -15.4±0.2 -9.8 ± 0.11 Plain nanoparticles 33.3 10 15,000 15 ----- 211 ± 24 289 ± 17 0.247 ± 0.005 0.412 ± 0.006 -13.8±0.3 -10.2±0.5 (=3) 41 SUNSCREEN FORMULATION CONTAINING PROPOLIS
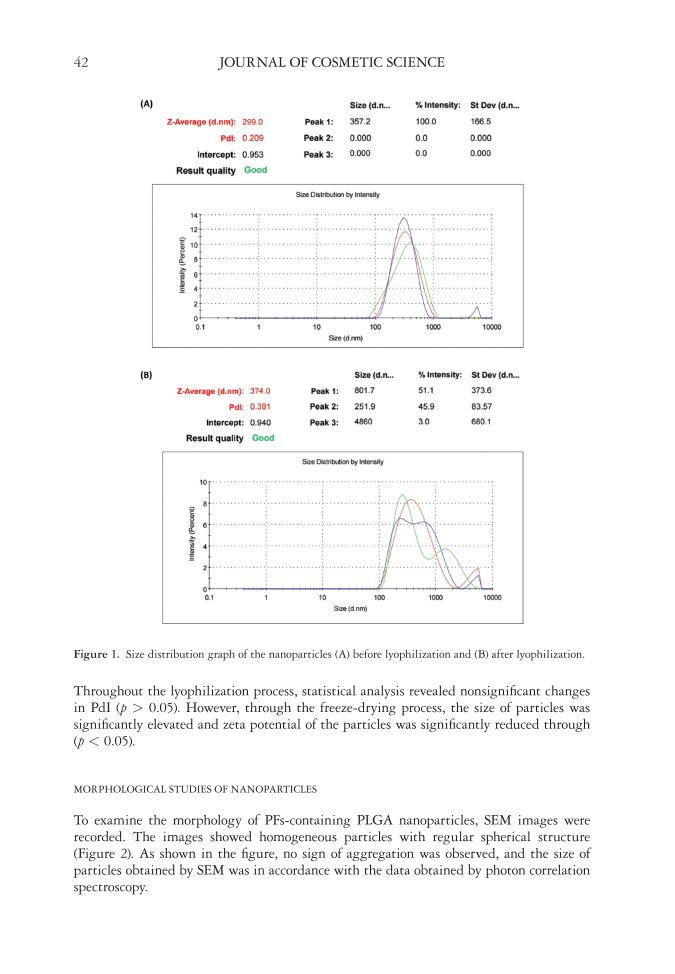
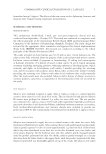
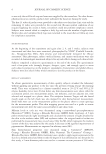
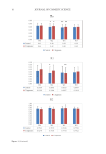
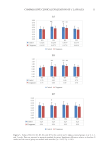
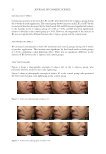
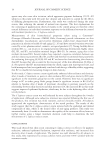
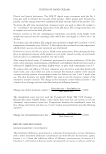
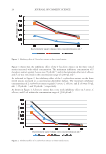
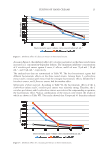
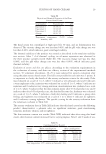
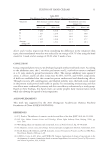
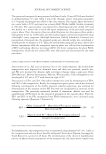
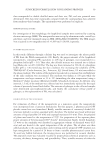
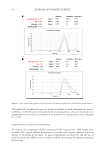
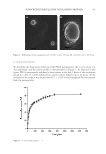
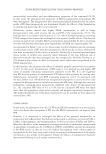
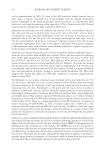
42 JOURNAL OF COSMETIC SCIENCE Throughout the lyophilization process, statistical analysis revealed nonsignificant changes in PdI (p 0.05). However, through the freeze-drying process, the size of particles was significantly elevated and zeta potential of the particles was significantly reduced through (p 0.05). MORPHOLOGICAL STUDIES OF NANOPARTICLES To examine the morphology of PFs-containing PLGA nanoparticles, SEM images were recorded. The images showed homogeneous particles with regular spherical structure (Figure 2). As shown in the figure, no sign of aggregation was observed, and the size of particles obtained by SEM was in accordance with the data obtained by photon correlation spectroscopy. Figure 1. Size distribution graph of the nanoparticles (A) before lyophilization and (B) after lyophilization.
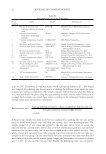
Purchased for the exclusive use of nofirst nolast (unknown)
From: SCC Media Library & Resource Center (library.scconline.org)