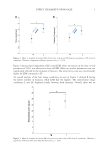
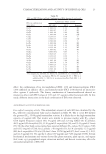
4 JOURNAL OF COSMETIC SCIENCE Second investigation: mascara effect with mask. Scenes of two images (LF versus LFM) were created, with either both images free of facial masks or both images with digitally applied facial masks. The behavioral task with eye-tracking measurements. For the first investigation (additive effect of makeup), the created scenes were presented to an evenly-mixed-gender panel of 8 viewers aged 18 to 50 years old (both male and female). As the panelists viewed the scenes, their gaze was monitored using an eye tracker (Gazepoint GP3 Eye Tracker, Vancouver, Canada). Scenes containing 2 images were displayed for 5 seconds, while scenes containing the 4 conditions were displayed for 10 seconds, with 2-second blank scenes containing a central red cross, in between scenes to resettle the panelists’ gazes. As such, images were randomized within a scene, and scene order was also randomized between viewers. Three different eye- tracking parameters were recorded and assessed as measures of gaze, as described in Table IV. After spontaneous viewing of the different scenes, panelists were then asked to estimate the perceived age and perceived health of the images, and rank the different conditions from the most attractive to the least attractive. The panelists were debriefed about the scope of the experiment at the end of the visit. The process was repeated for the second investigation (mascara effect with masks), with a different evenly-mixed-gender panel of eight viewers. Statistics. Differences in gaze between image conditions were compared using paired t-test (two conditions) or repeated-measures analysis of variance (ANOVA) with least significant difference post hoc (four conditions). Differences in perceived age, perceived health, and attractivity were compared using Wilcoxon Matched Pairs Test (two conditions) or Friedman ANOVA (four conditions). Repeated measures correlations were computed to assess the associations of gaze parameters versus attractivity, perceived health, or perceived age. All calculations were performed using STATISTICA V14 (Tibco, Palo Alto, CA, USA), except for repeated measures correlation, which used the standalone rmcorrShiny app. The significance level was set at α =0.05 throughout the analysis. RESULTS As outlined in Figure 2, images with lipstick received more gaze and visual fixation from the panelists during the study compared to bare skin condition. Results from the eye-tracking analysis show that an increase of 18.1% in the time viewed parameter was observed when lipstick was applied versus a bare skin condition. In addition, an increase of 12.6% in the visual fixation parameter was observed when lipstick was applied versus a bare skin condition. With regards to the perceived attractivity of the bare skin condition versus lipstick applied, the latter yielded a higher score (Figure 3). Table IV Eye Tracking Parameters Eye tracking parameter Description Time viewed Quantifies the amount of time that panelists have spent looking at a particular area of interest, e.g., eyes/mouth also referred to as “dwell time” Visual fixation The maintenance of visual gaze on a single area of interest for a duration of at least 100 ms Revisits The number of revisits quantifies how many times a panelist returned their gaze to a spot, defined by an area of interest

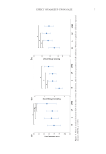
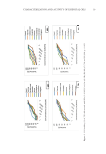
5 EFFECT OF MAKEUP UPON GAZE Figure 4 shows paired comparison of LF versus LFM, where an increase in the time viewed parameter of 15.5% was observed in favor of LFM. Other eye-tracker parameters were not significantly affected by the inclusion of mascara. The attractivity score was concomitantly higher for LFM compared to LF. An overall analysis of the four image conditions, as seen in Figure 5, showed B having the lowest number of fixations, while LFM had the highest. The intermediate image conditions, L and LF, displayed results between both extremes. Overall, there was an Figure 2. Mean ± standard deviation (SD) of (A) time viewed and (B) fixations parameters of B versus L conditions. *Denotes a significant difference (paired t-test, p 0.05). Figure 3. Mean ± standard deviation (SD) of attractivity sum count of B versus L conditions. *Denotes a significant difference (Wilcoxon Matched Pairs Test, p 0.05).
Purchased for the exclusive use of nofirst nolast (unknown)
From: SCC Media Library & Resource Center (library.scconline.org)