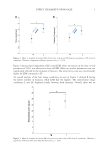
36 JOURNAL OF COSMETIC SCIENCE a broad spectral peak was observed at 500 nm (Figure 2). The results obtained from the UV-visible spectra suggested the formation of AgNPs–bee honey nanoparticles. FTIR ANALYSIS Only naturally obtained bee honey has been used to characterize the spectroscopic properties. Typically, the characteristic differences in the FTIR spectral analysis for bee honey and AgNPs–bee honey nanoparticles were observed (Figure 3). The O-H stretching vibration band is very broad and occurs in the field of 3,400 to 3,000 cm−1 with the maximum at 3,285 cm−1. This is the same area as the stretching vibration region for carbon and aromatic C-H groups. The O-H bending can appear in 1,418 to 1,339 cm−1 and 1,026 cm−1. The stretching vibration band of the C-O stretching occurs at 1,646 cm−1. The exact position of the band depends on whether the acid is saturated Figure 1. Visual observation of silver nanoparticles formation: (a) bee honey and (b) AgNPs–bee honey nanoparticles. Figure 2. UV-visible spectra of AgNPs–bee honey nanoparticles biosynthesis at different times of incubation.

37 Silver Nanoparticles of Bee Honey or unsaturated, dimerized, or associated. However, the band under 1,026 cm−1 cannot be distinguished from C-H bending bands. PARTICLE SIZE DISTRIBUTION The average particle size was found to be 273 nm with a polydispersity index (PDI) value of 0.314 (Figure 4). Thus, the results indicate that the bee honey has been found to be capable of synthesizing silver nanoparticles. Figure 3. FTIR spectrum of the biosynthesized AgNPs–bee honey nanoparticles. Figure 4. Particle size distribution of AgNPs–bee honey nanoparticles.
Purchased for the exclusive use of nofirst nolast (unknown)
From: SCC Media Library & Resource Center (library.scconline.org)