233 IMPROVEMENT OF MELASMA WITH GLABRIDIN
of the tissue luminance values (L* unit) using a CM-2600d Spectrophotometer® (Konica
Minolta, Tokyo, Japan), and the melanin reduction was quantified spectrophotometrically
by solubilizing the tissue using solvable.
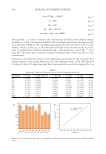
MELANIN CONTENT MEASUREMENT
Briefly, the cell pellets were solubilized in 1 mol/L NaOH (80°C) for 40 minutes. The
melanin was evaluated at 405 nm using a spectrophotometer. Melanin was determined by
the protein’s absorbance from the cell extract.
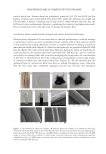
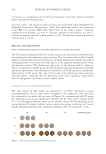
MELANIN DISTRIBUTION
All samples were fixed with 4% formaldehyde solution for 24 hours after 8 days of cell
culture. The sliced samples were stained according to the silver staining kit directions,
and then photographed under the microscope. Intel® Integrated Performance Primitives
(Intel, California, USA) software was used to determine the relative integral optical
density (IOD).
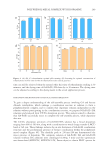
CLINICAL STUDY
Subjects. 33 Chinese urban women between the ages of 33 and 51 were enrolled in
the study. These selected volunteers showed the following characteristics: lackluster
complexion, color spot density on the cheek of ≥2, at least one 2 mm independent
color spot on the face, no obvious redness, and skin lesions or scars on the face. During
the study period, strong sun exposure was to be avoided. All subjects participating in
this study signed an informed consent form. Patients were excluded from the study
if they were pregnant, breastfeeding, in hormone or corticosteroid therapy, or had
a history of endocrine disorders or allergies. Additionally, potential volunteers who
used depigmenting or whitening products (oral or topical) in the past 6 weeks were
excluded.
Test materials and procedure. The test formula contained glabridin was in a vehicle base. A
neutral cream without glabridin was used as a placebo. Additionally, the whitening essence
passed the safety test. Both study formulas were identical in appearance and supplied with
two identical pump dispensers. One test formula was applied twice a day on the subjects’
right face and the other one on the left face for 56 days, and the subjects were also asked to
not use any cosmetics containing ingredients that could potentially interfere with their skin
color status during the study period. The skin color (Colorimeter® CL400, EnviroDerm
Services, Longhope, UK), melanin index value (Mexameter® MX18, EnviroDerm Services,
Longhope, UK), the gloss of skin (Glossymeter® GL200, EnviroDerm Services, Longhope,
UK) and photographic documentation (VISIA-CR, Canfield Scientific Inc., New Jersey,
USA) were evaluated at baseline, then at 14 days, 28 days, and 56 days after treatment.
During evaluation, the entire study was conducted under controlled environmental
conditions of temperature and relative humidity. Participants were asked to rest for at least
of the tissue luminance values (L* unit) using a CM-2600d Spectrophotometer® (Konica
Minolta, Tokyo, Japan), and the melanin reduction was quantified spectrophotometrically
by solubilizing the tissue using solvable.
MELANIN CONTENT MEASUREMENT
Briefly, the cell pellets were solubilized in 1 mol/L NaOH (80°C) for 40 minutes. The
melanin was evaluated at 405 nm using a spectrophotometer. Melanin was determined by
the protein’s absorbance from the cell extract.
MELANIN DISTRIBUTION
All samples were fixed with 4% formaldehyde solution for 24 hours after 8 days of cell
culture. The sliced samples were stained according to the silver staining kit directions,
and then photographed under the microscope. Intel® Integrated Performance Primitives
(Intel, California, USA) software was used to determine the relative integral optical
density (IOD).
CLINICAL STUDY
Subjects. 33 Chinese urban women between the ages of 33 and 51 were enrolled in
the study. These selected volunteers showed the following characteristics: lackluster
complexion, color spot density on the cheek of ≥2, at least one 2 mm independent
color spot on the face, no obvious redness, and skin lesions or scars on the face. During
the study period, strong sun exposure was to be avoided. All subjects participating in
this study signed an informed consent form. Patients were excluded from the study
if they were pregnant, breastfeeding, in hormone or corticosteroid therapy, or had
a history of endocrine disorders or allergies. Additionally, potential volunteers who
used depigmenting or whitening products (oral or topical) in the past 6 weeks were
excluded.
Test materials and procedure. The test formula contained glabridin was in a vehicle base. A
neutral cream without glabridin was used as a placebo. Additionally, the whitening essence
passed the safety test. Both study formulas were identical in appearance and supplied with
two identical pump dispensers. One test formula was applied twice a day on the subjects’
right face and the other one on the left face for 56 days, and the subjects were also asked to
not use any cosmetics containing ingredients that could potentially interfere with their skin
color status during the study period. The skin color (Colorimeter® CL400, EnviroDerm
Services, Longhope, UK), melanin index value (Mexameter® MX18, EnviroDerm Services,
Longhope, UK), the gloss of skin (Glossymeter® GL200, EnviroDerm Services, Longhope,
UK) and photographic documentation (VISIA-CR, Canfield Scientific Inc., New Jersey,
USA) were evaluated at baseline, then at 14 days, 28 days, and 56 days after treatment.
During evaluation, the entire study was conducted under controlled environmental
conditions of temperature and relative humidity. Participants were asked to rest for at least