235 IMPROVEMENT OF MELASMA WITH GLABRIDIN
MELANIN DISTRIBUTION
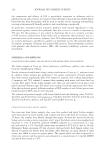
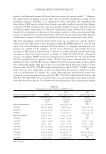
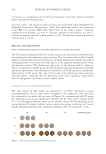
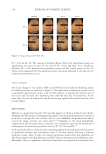
In Figure 3A, compared with the BC, the distribution of melanin granules in the NC
group increased, while the distribution of melanin granules of the model in the PC group
decreased significantly. Compared with the NC group, the distribution of melanin granules
in the whitening serum group clearly decreased, indicating that the whitening serum had
a significant improvement on the reduction of melanin granules in the melanin model.
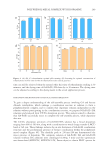
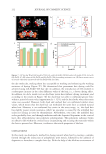
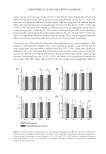
The relative IOD value represents relative stain fluorescent strength. As can be seen
quantitatively in Figure 3B, the NC group, 50mJ/cm2 UVB, produced a relative IOD of
3.2. It shows the induction of melanin accumulation significantly (P 0.01). Compared
with the NC group, the relative IOD value of whitening essence group was significantly
decreased 78.1% (P 0.01).
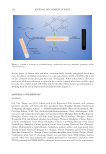
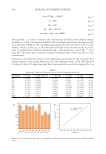
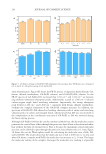
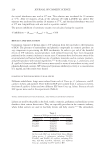
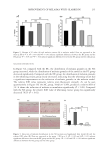
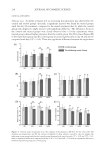
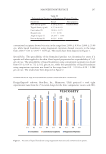
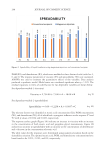
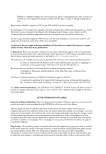
Figure 2. Changes of L* value (A) and melanin content (B) in melanin model. Data are expressed as the
mean ± SD (n =3). #P 0.05 and ##P 0.01 indicate significant differences between the BC group and the
NC group. *P 0.05 and **P 0.01 indicate significant differences between the NC group and the other group.
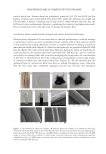
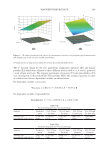
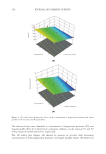
Figure 3. Detection of melanin distribution in the 3D reconstructed pigmented skin model (A) and the
relative IOD value (B). Data are expressed as the mean ± SD (n =3). #P 0.05 and ##P 0.01 indicate
significant differences between the BC group and the NC group. *P 0.05 and **P 0.01 indicate significant
differences between the NC group and the other group.
MELANIN DISTRIBUTION
In Figure 3A, compared with the BC, the distribution of melanin granules in the NC
group increased, while the distribution of melanin granules of the model in the PC group
decreased significantly. Compared with the NC group, the distribution of melanin granules
in the whitening serum group clearly decreased, indicating that the whitening serum had
a significant improvement on the reduction of melanin granules in the melanin model.
The relative IOD value represents relative stain fluorescent strength. As can be seen
quantitatively in Figure 3B, the NC group, 50mJ/cm2 UVB, produced a relative IOD of
3.2. It shows the induction of melanin accumulation significantly (P 0.01). Compared
with the NC group, the relative IOD value of whitening essence group was significantly
decreased 78.1% (P 0.01).
Figure 2. Changes of L* value (A) and melanin content (B) in melanin model. Data are expressed as the
mean ± SD (n =3). #P 0.05 and ##P 0.01 indicate significant differences between the BC group and the
NC group. *P 0.05 and **P 0.01 indicate significant differences between the NC group and the other group.
Figure 3. Detection of melanin distribution in the 3D reconstructed pigmented skin model (A) and the
relative IOD value (B). Data are expressed as the mean ± SD (n =3). #P 0.05 and ##P 0.01 indicate
significant differences between the BC group and the NC group. *P 0.05 and **P 0.01 indicate significant
differences between the NC group and the other group.