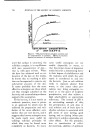
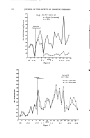
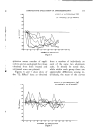
• DEGERMING EFFICIENCY OF HEXACHLOROPHENE SOAPS 285 soap containing the hexachlorophene has been applied for the daily (three times) use of the latter over the two weeks period then repeated on the fifth day (Friday, of the first week) and again on the following Thursday a.m. (before the test soap has been used that day) and then on Friday a.m. At least two hours should elapse between the time a wash test with blank soap is made and that of the previous use of the test soap. 7. At the end of the two weeks' test period, each subject should stop using the test soap and go back to the daily normal routine of using soap containing no germicide, for a period of two weeks. Washing tests as described in paragraphs 3 and 4 above should be run on the respective Fridays of these two weeks. When the bacterial counts show that the subjects have returned to normal, they may be used again for another series of tests. Empha- sis is placed upon the necessity of determining this fact of back to nor- real before the individual in question is utilized again as a test subject. The reasons for this requirement are obvious. 8. Thus, the essential data used as the guide in determining the efficacy of hexachlorophene soap in reducing the resident bacterial flora of the skin comprise: (a) The first, fourth, and fifth basin counts of the normal first-day transient and resident flora. (b) The first, fourth, and fifth basin counts at the start of the fifth day of daily use of the test soap. (c) The first, fourth, and fifth basin counts at the start of the ninth day of daily use of the test soap. (d) The first, fourth, and fifth basin counts at the start of the tenth day (i.e., after ten days' use of the test soap). It should be noted that these ninth and tenth day references are for the respective Thursday and Friday of the second week, assum- ing the test soap was used for five days (Monday through Friday) con- tinuously the first week, then again for five continuous days (Monday- Friday) of the second week. A two-day layover for the week end will not harm the end results, pro- vided care is taken to be sure that no materials are used on the hands or skin during that period which might remove the hexachlorophene. Thus, no germicidal substance other than the test soap should be used over the week end, nor at any other time during the two weeks of the testing. Keep solvents away from the hands also during the two weeks' test period for the same reason. EVALUATING THE DATA Having completed the tests and collected the data as to the number of bacteria removed from the skin of the subject, the next step is to plot that data so as to indicate what effect the continuous daily use of hexachlorophene soap has on the bacterial contents of the skin. This is accomplished by plotting the counts of bacteria removed from the two hands as the ordinate, and the individual basin numbers as abcsissa.

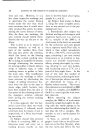
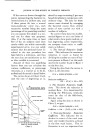
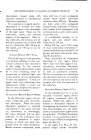
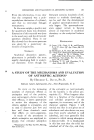
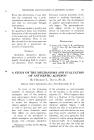
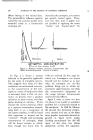
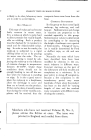
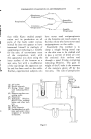
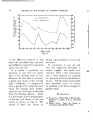
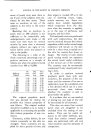
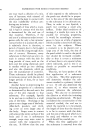
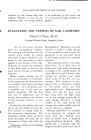
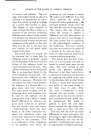
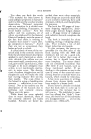
286 JOURNAL OF THE SOCIETY OF COSMETIC CHEMISTS If the curve as drawn through the points representing the bacterial re- moved counts is a uniform one and if these points fit into a normal mono-molecular curve (i.e., each successive number being the same percentage of its preceding number) you can assume the subject is a nor- mal one for these test purposes. Also, if at the same time, at least five of the six subjects used show results which are within reasonable experimental error, you can safely assume that the personal' factor in- volved in the test procedure has been held to a minimum, and 1}bus the test data are satisfactory as far as that variable is concerned. Assured of these two qualifying factors then one can calculate the various coefficients, or percentage removals, in a manner as to be de- scribed and discussed in detail below. The curves shown in Chart 2 indi- cate the rate of degerming as in- G-'11 DEGERMING DATA % .•,s•.o .... TA (.,•.) X'"x. '•' ALCOHOL )TH.OAY I•H D' NUMBER OF WASHES OR BASINS Chart 2 duced by soap containing 2 per cent hexachlorophene in comparison with ordinary soap. The data for these curves were obtained by averaging the bacterial counts from several series of tests carried out with a number of subjects. To convert these data into mathe- matical figures so as to set limits of what results show good, medium, or bad degerming action respectively, we compute three ratios or coeflq- cients as follows: 1. The Over-all Reduction Coeffi- cient. This indicates the maximum reduction in count as found by dividing the number or count of bac- teria present in Basin $ on the tenth day by the number found in Basin 1 on the first day. Using the data from the curves in Chart 2, this becomes: D/zt = 50,000/4,250,000 = 0.0! or Reduction coefficient = 100 - (D/d) X 100 = 99% 2. The Resident Reduction Coeffi- cient. This shows the reduction in resident flora. It is determined by dividing the fifth-basin, tenth-day count by that of the fifth-basin, first-day count. Again using the data as shown in Chart 2, we get: D/B = 50,000/2,400,000 = 0.02 Coefficient = 100 -- (D/B) X 100 = 98% 3. Transient-Resident Reduction Coefficient. This indicates the re- duction in count of the total tran- sient and resident bacteria as found in the first wash basins. This in- formation is not too important but
Purchased for the exclusive use of nofirst nolast (unknown)
From: SCC Media Library & Resource Center (library.scconline.org)