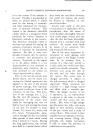
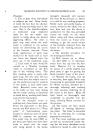
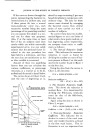
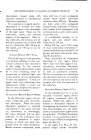
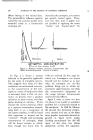
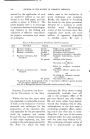
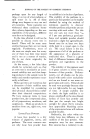
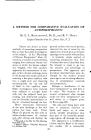
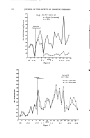
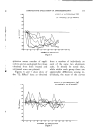
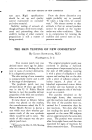
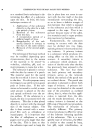
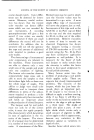
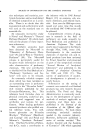
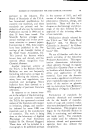
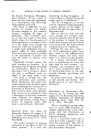
286 JOURNAL OF THE SOCIETY OF COSMETIC CHEMISTS If the curve as drawn through the points representing the bacterial re- moved counts is a uniform one and if these points fit into a normal mono-molecular curve (i.e., each successive number being the same percentage of its preceding number) you can assume the subject is a nor- mal one for these test purposes. Also, if at the same time, at least five of the six subjects used show results which are within reasonable experimental error, you can safely assume that the personal' factor in- volved in the test procedure has been held to a minimum, and 1}bus the test data are satisfactory as far as that variable is concerned. Assured of these two qualifying factors then one can calculate the various coefficients, or percentage removals, in a manner as to be de- scribed and discussed in detail below. The curves shown in Chart 2 indi- cate the rate of degerming as in- G-'11 DEGERMING DATA % .•,s•.o .... TA (.,•.) X'"x. '•' ALCOHOL )TH.OAY I•H D' NUMBER OF WASHES OR BASINS Chart 2 duced by soap containing 2 per cent hexachlorophene in comparison with ordinary soap. The data for these curves were obtained by averaging the bacterial counts from several series of tests carried out with a number of subjects. To convert these data into mathe- matical figures so as to set limits of what results show good, medium, or bad degerming action respectively, we compute three ratios or coeflq- cients as follows: 1. The Over-all Reduction Coeffi- cient. This indicates the maximum reduction in count as found by dividing the number or count of bac- teria present in Basin $ on the tenth day by the number found in Basin 1 on the first day. Using the data from the curves in Chart 2, this becomes: D/zt = 50,000/4,250,000 = 0.0! or Reduction coefficient = 100 - (D/d) X 100 = 99% 2. The Resident Reduction Coeffi- cient. This shows the reduction in resident flora. It is determined by dividing the fifth-basin, tenth-day count by that of the fifth-basin, first-day count. Again using the data as shown in Chart 2, we get: D/B = 50,000/2,400,000 = 0.02 Coefficient = 100 -- (D/B) X 100 = 98% 3. Transient-Resident Reduction Coefficient. This indicates the re- duction in count of the total tran- sient and resident bacteria as found in the first wash basins. This in- formation is not too important but

DEGERMING EFFICIENCY OF HEXACHLOROPHENE SOAPS 287 is of sufficient value relative to the other two coefficients to warrant its being observed and calculated, and used in the general over-all inter- pretation of all of the data. Calculated also from the above curves (Chart 2), it becomes: c//1 = 100,000/4,250,000 = 0.02 Coefficient = 100 -- (C/,'t)) 100 = 98% It will soon become evident to anyone using this test procedure, or any other modification of this mul- tiple-basin technique for determining the bacterial removal from the skin, that exact duplicate results are difficult to o•ain. Due to the individu3.1 differences in the subjects themselves, both as to normal skin flora and as to uniformity of tech- nique applied, some will find their original counts to be much higher than shown here, while others will be found to be appreciably lower. These may range all the way from around 12,000,000 down to around 1,000,000. Thus, .4 of curve may be found to be any figure be- tween these two extremes, instead of 4,250,000 as the above chart shows it to be for these average test data. The point B of the same curve may likewise rise or fall above or below where it is found to be as pre- sented in the above chart (at 2,400,000). Experience has indicated, how- ever, that no matter where the original or control counts may be, the respective percentage reductions (or coefficients as calculated above) remain quite constant. Thus, when using hexachlorophene (2 per cent on soap-weight basis) as the degerming agent, be the initial count 10,000,000 or 2,000,000, for example, the D/.4 equivalent of over-all reduction coefficient will generally fall within the range of 95 4- 5 per cent. In a few cases, it may go as low as 85 per cent, or even once in a while to 80 per cent, due to the personal factors referred to above. With a series of subjects, the majority should defi- nitely show results in the 95 per cent ra, nge. Similarly, the results for the resident coefficient may vary for the same reasons. The slope of the curve .4B (or its equivalent) may become steeper in some cases or less steep in other tests. Thus, the results for D/B may safely vary through a range. In gen- eral, this range for the coefficient is also 95-+5 per cent, but occa- sionally may go as low as 80 per cent, for the same reasons as given above. Thus, for example, if the original control should be found to be .4'B' instead of .4B, with the degerming effect shown by CD as before, the respective coefficients would then be: 1. D/,-'I': 50,000/1,600,000 = 0.03 coeff. = 100 - 3 = 97% 2. D/B': 50,000/900,000 = 0.05 eoeff. --- 100 -- 5 = 95% 3. C/•I': 100,000/1,600,000 -- 0.06 coeff. = 100 -- 6 = 94% And, if the original control was found to be XY instead of and the degerm curve CD then the respective coefficients would become: 1. D/X: 50,000/3,100,000 = 0.02 coeff. = 100 -- 2 = 98%
Purchased for the exclusive use of nofirst nolast (unknown)
From: SCC Media Library & Resource Center (library.scconline.org)