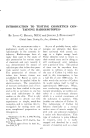
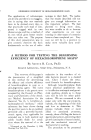
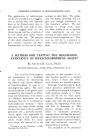
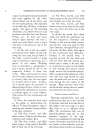
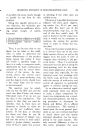
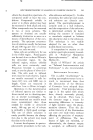
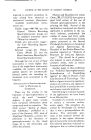
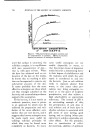
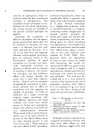
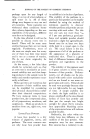
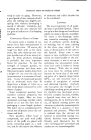
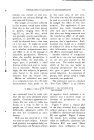
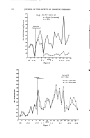
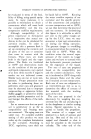
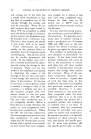
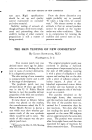
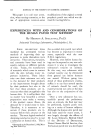
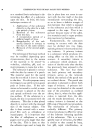
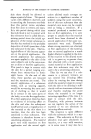
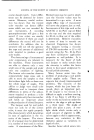
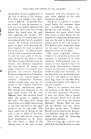
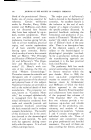
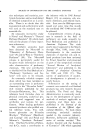
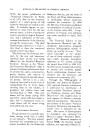
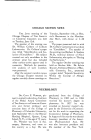
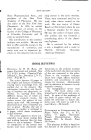
313 ,.' &e COMPARATIVE EVALUATION OF ANTIPERSPIRANTS Figure 6 spiration versus number of appli- from a number of individuals on cations andon each graph the values each of the same two aluminum obtained from both treated and salts. It should be noted that, untreated arms are plotted. while within each group there are Figures 6 and 7 show plots of appreciable differences among in- the "% Effect" data as obtained dividuals, the mass of the curves O, c Figure 7

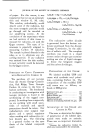
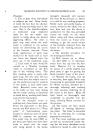
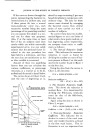
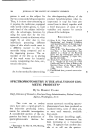
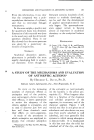
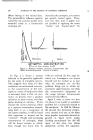
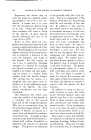
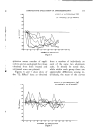
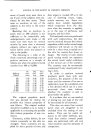
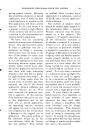
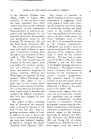
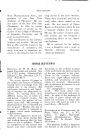
314 JOURNAL OF THE SOCIETY OF COSMETIC CHEMISTS f• :) 4.0 '1o I I I J I I I I I I I I •12 G • lB 9 12. I$ •. 15' 16 19 2o 2 I Figure 8 4.0 of the effective material is well below the zero-effect line, and with the ineffective material it is centered about the zero line. It is hardly a profound ob- servation to note that one sweats more in hot weather than in cool. However, for the sake of curiosity, a graph was made of the average daily milligrams of perspiration from a group of 11 untreated arms versus the average daily temper- atures for the same days as obtained from the Weather Bureau. There is a pleasingly close correspondence of the ups and downs of the two curves as shown in Fig. 8. The month of April was chosen as giving a good spread of warm and cool days. In conclusion, it may be said that the apparatus described is simple, rugged, and easily con- structed. Only a few instructions and a little practice are required for operators to become proficient in its use. The procedure and method here described may, of course, be modified to fit the investigator's specific needs. REFERENCES (1) Kuno, Yas., "Physiology of Human Per- spiration," London, J. & A. Churchill (1934). (2) Minor, Victor, Zentr. ges. Neurol. u. Psychiatrie, 47, 800-803 (1927).
Purchased for the exclusive use of nofirst nolast (unknown)
From: SCC Media Library & Resource Center (library.scconline.org)