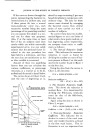
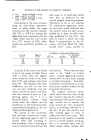
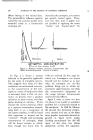
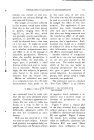
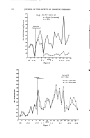
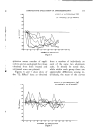
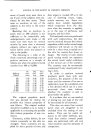
288 JOURNAL OF THE SOCIETY OF COSMETIC CHEMISTS 2. D/Y: 50,000/1,750,000 = 0.03 coeff. = 100 -- 3 = 97% 3. C/X: 100,000/3,100,000 = 0.03 coeff. = 100 -- 3 = 97% Calculating in the same manner, using the same three representa- tions as being within the range variations for the controls (namely, AB, XY, or A'B') but having the degerming data represented by the "high" rather than the "low" curves (i.e., C'D' instead of CD), which results are practically possible, we find: skin equal to or preferably better than that as produced by the normal surgical scrub-up procedure. Therefore, we set as our criterion for satisfactory degerming action an end point which indicates that this desired action has been accom- plished by, at least, the fifth wash- ing preferably by the third. See lines in Chart 2 which run from Basin 3 perpendicular to the ab- scissa and from Basin 10, "af•ter alcohol wash" count, parallel to Control Degerm Curve Curve ,--Coefficient or Percentage Reduction--, 1. 2. 3. Transient- Over-all Resident Resident AB C'D' 90 80 80 XY C'D' 84 70 67 A'B' C'D' 67 50 40 Actually, if the control was found to be in the range of either Curve A'B' or C'D', then the degerm curve would be found to be lower than C'D', and perhaps even lower than CD. This explains why these coefficients are low for the last two sets just tabulated, and also shows, should one obtain such data, that the material is poor as a de- germing agent and if it is a hexachlorophene mixture being tested either the subjects are not satisfactory or the mixture has been compounded improperly, or has too little hexachlorophene in it. We assume in this connection that the basic criterion for a satis- factory degerming agent is that it should, when used according to this procedure, show a lowering in count of bacteria removed from the the abscissa. Where these two lines meet is the "ideal" or critical point. A good degerming material should show its third basin reading to be below that point. Naturally, should the control itself be at or near that point, another subject should be used for the testing. The surgical scrub-up curve, which shows how the count of the skin bacteria removed by ordinary soap decreases with successive wash- ings, carried out in exactly the same manner for nine consecutive basins, or washings, followed by a dip into 70 per cent alcohol, and then washing again in order to collect the tenth basin data. This procedure is not exactly as carried out in a normal hospital scrub-up, but it is aksumed here, and by others doing similar testing, that

DEGERMING EFFICIENCY OF HEXACHLOROPHENE SOAPS 289 it parallels the same closely enough to justify its use here for this purpose. Using this specific end point as our objective, the minimum per- centage reduction coefficient, allow- ing ample margin of safety, becomes: 1. Over-all reduction coefficient must be 85% 2. Resident reduction coefficient must be 80% 3. Transient-resident reduction coefficient must be 85% Thus, it can be seen that no one figure can be taken as the coeffi- cient in order to determine the exact effectiveness of the product being tested, but rather it must fall within a specified range. In fact, it is really a composite result, determined by both mathematical calculations and by visual obser- vations of the curves. As men- tioned above, the control curve should be a mono-molecular one and the degerm curve should have a less steep slope and be nearer to the horizontal. The question may be asked, why we run the fifth day and the ninth day (first Friday and second Thursday) tests if we do not use the data in the calculations. The answer is that they are used in- directly that is, these data are observed as checks on those we do use for our coefficient calcu- lations. If the data as obtained for those two days do not fit into the "scheme of things" (i.e., fall into the curves in their antici- pated or proper places), consider- ation of that is taken into account in deciding if the other data are reliable to use. Likewise, it is possible that certain subjects will show good degerm- ing results (i.e., 95q-5 per cent) even after five days' use of the hexachlorophene soap (i.e., at the end of the first week's test). If such is found to be the case, natu- rally it would not be necessary to continue the testing for another week in order to obtain the ten- day data. From what has been stated above, it is obvious that one of the most likely sources of error, as well as the biggest from the point of view of irregular data obtained, is the per- sonal factor. Thus, it is extremely important that the person doing the hand-washing, both for the three- times daily application of the medi- cated soap and, especially, for the bacterial count test washings with the blank soap, performs the task with the utmost of uniformity and avoids all exposure to germicidal agents or solvents during the test. As an alternative method, appli- cable especially when one desires to make a direct comparison be- tween two compounds, one a stand- ard (hexachlorophene), the follow- ing procedure as developed by Gump and KillJan (3) is offered for consideration. This method is based upon the same general prin- ciples as our own method described in detail above and the results obtained therefrom can be inter- preted in the same manner. The only material difference is that in this latter procedure the same
Purchased for the exclusive use of nofirst nolast (unknown)
From: SCC Media Library & Resource Center (library.scconline.org)