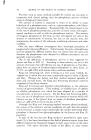
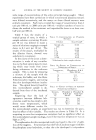
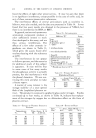
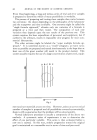
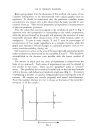
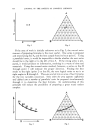
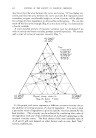
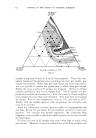
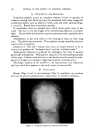
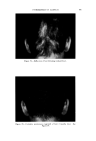
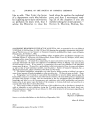
USE OF TERNARY DIAGRAMS 467 Thus, if these parallel lines (between vertex "A"' and side B-C) are drawn at 1 per cent intervals, any point within the triangle can easily be read as "per cent A in mixture A q- B q- C." Similarly, if lines parallel to sides A'C and A'B are drawn at 1 per cent intervals (to vertices B and C, respectively), the proportions of both B and C may also be read as percentages of mixture A' q- B q- C. Thus, any point within the triangle will repr.esent ratios of A' q- B q- C which total 100 per cent, the formula for that point. In formulation work it is necessary to relate product properties to varia- tions of the components. In the two dimensional diagram, this cannot be done without including the property as a variable. It is done by means of a curve as shown in Fig. 5 representing, (e.g.), viscosity. ,%ap-OJl •ooo• A D Alcohol-100% Phya,c•l cM.!ies relaf,ve to B Water-•oo% Soap-0il, Alcohol , WQf. r. Fig. 9 But this curve itself varies and therefore must be marked off as indi- cated to demonstrate how the viscosity changes as the two components (X and Y) are varied. In the triangular diagram (Fig. 6), the curve rep- resents a constant viscosity and defines all the combinations of the three variables, A, B and C that wi}l produce this constant property. If we

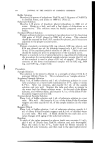
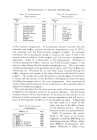
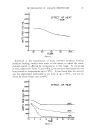
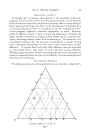
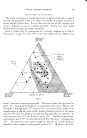
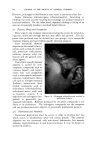
468 JOURNAL OF THE SOCIETY OF COSMETIC CHEMISTS also know that the area between the curve and vertex "A" has higher vis- cosity, and that the area between the curve and side B-C represents lower viscosities, we gain considerable insight as to how viscosity will be affected by varying all three ingredients in all possible combinations. We can also mark off the line in the triangle (Fig. 6) as was done in Fig. 5 to demonstrate a fourth variable. A more detailed picture of viscosity.variation may be developed if we wish to include the fourth variable, perhaps a fourth ingredient. We merely add a series of curves of constant viscosity (Fig. 7). 60% $o•p.-0il 07o Alcohol /,OYo Water O Clear llguid •2 Cloudy I,c}u,d © Opegue 9el ß Op•oue I,gui& ß C•oua• gel O Clear gel 5oap-0il Physical .ebontie relative fo to % 5o•p-0il Alcohol o 7 Alcohol Water Soap- OiJ• Alcohol •- •h/afer 90• Water Fig. 9A In this graph, each curve represents a different constant viscosity due to the addition of varying amounts of a fourth ingredient. It is easy to pick a particular value of ingredient to give the specific viscosity desired for the final product. This viscosity can be achieved by combining that value of the ingredient with any of the combinations of`4, B and C appearing on the constant viscosity curve. The final choice of the most desirable ratio of .4, B and C will now depend on other factors such as cost, final "feel," texture, stability, etc.
Purchased for the exclusive use of nofirst nolast (unknown)
From: SCC Media Library & Resource Center (library.scconline.org)