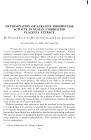
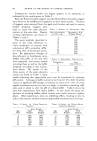
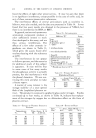
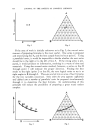
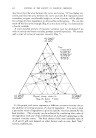
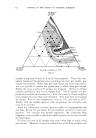
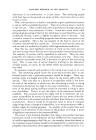
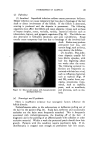
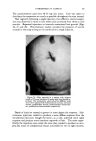
USE OF TERNARY DIAGRAMS 465 RECORDING THE DATA An integral part of product development is the recording of formulas prepared and the results of tests and measurements made on each formula. Such information determines the direction of future efforts toward the goal. Since speed is an all important factor in the development of formulas by a commercial laboratory, there is a tendency to use the "multiple formula" (crash program) approach somewhat desperately at times. However, unless an efficient system is used to record the information obtained, the larger number of formulas so prepared often simply results in greater con- fusion, retarding progress rather than accelerating it. Furthermore, it is reasonable to believe that the pressure of competition is already forcing most commercial laboratories to work close to the current limit of their efficiency. To expand their work load, either efficiency must be improved, or more people hired. The latter is costly and often causes confusion. Dividing a general project between several groups may cause the project to evolve in tangential directions due to the difficulty of communicating exact ideas between individuals. THE TERNARY DIAGRAM The Following discussion will graphically demonstrate that a laboratory's A •50 •o bo 2.0 ¾iscos ty relative to A,I• • C. Fig. 7 IO

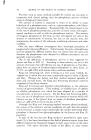
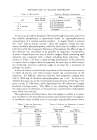
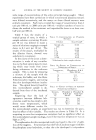
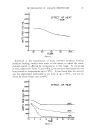
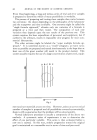
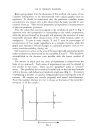
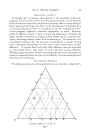
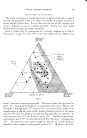
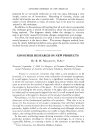
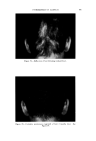
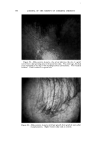
466 JOURNAL OF THE SOCIETY OF COSMETIC CHEMISTS output can be greatly increased, both by applying the principle of crossed series and paralleled series samples in the proper order, and by improving its methods of recording test results. The method proposed in this paper increases the assurance that all work done is purposeful, leading toward a desired goal with a minimum of random effort. Interpreting data from records normally kept in cosmetic product de- velopment is limited by their two dimensional character. For example a single point on a typical XY axis chart can only relate the two variables X and Y simultaneously as in Fig. 3. Our approach to this problem uses a ternary diagram in the form of an equilateral triangle to record test results more clearly. In this system, one point relates three variables simul- taneously as shown in Fig. 4. For the sake of clarity let us first review the properties of such diagrams. Emtdsifier IOO% Wa•er 10o% Oil Io0% Fig. 8 The vertices, ,4, B and C of the triangle can each represent 100 per cent of a given variable. The side B-C represents various ratios of "B" and "C" but excludes variable "A" entirely. Any line parallel to the side B-C represents a cbntant ratio of "A" combined with varying ratios of "B" and "C." The closer this parallel line appears to vertex ",4," the greater is the proportion of"A" until a maximum of 100 per cent is reached.
Purchased for the exclusive use of nofirst nolast (unknown)
From: SCC Media Library & Resource Center (library.scconline.org)