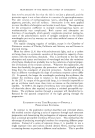
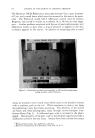
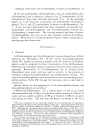
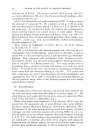
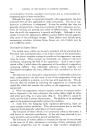
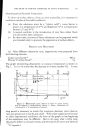
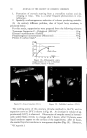
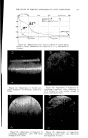
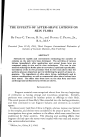
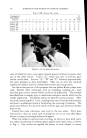
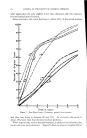
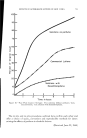
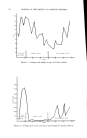
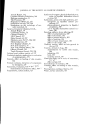
THE STUDY OF SURFACE ANOMALIES OF FATTY SUBSTANCES 743 Suppocire BS2X is an interesterified hydrogenated palm oil combined with fatty acid esters of polyoxyethylene. It is marketed by Gattefoss•- sfpao APPENDIX II. Examination of the final portion of the curves of dilatometry at constant temperature shows that the time values and the expansion values con- stituted a series proportional to the series x 1 2 4 8 ... 2 • of general terms xn = 2 • and y• = •n, which are linked by the hyperbolic relation yn = lx•. In a system of orthonormal axes, this yields an equi- lateral hyperbola. The part of this hyperbola which is relevant corresponds to x 0 and y 0, i.e., the branch asymptotic to time. The other pairs of series pro- portional to x• and y• have other equilateral hyperbolas as graphs which can be considered as resulting from the use of other unit vectors, corresponding to a simple point-by-point transformation represented by a matrix one obtains, for example, graph G2 from graph G• (cf. Fig. 27), through the matrix transformation It may be recalled that such a transformation leaves the symmetry of the curve invariant in relation to the bisector of the axes. A simple geometric property of the hyperbola enables one to determine the asymptote to time from the experimental graph. Consider points M (1, 1) and P (2, •/•) be- longing to (G0. coM is the bisector of orthonormal reference aingle cox, coy, and tangent T at Mhas a slope of -45 ø. Let •be the projection of M on cox and N the projection of P on •M. In triangle MNP, MN = • and NP = 1. Angle NMP is equal to % the tan of which is 2. This also applies to triangle NoOP. (Similarly, in the case of G2, point •' is the pro- jection of M' on cox.) The determination of the asymptote cox is then carried out as follows: M is found as the point through which tangent Tpasses with its slope -45 ø (this is relatively easy if the curve is plotted on graph paper. The posi- tion of point M is obviously approximate). From point M, a vertical line Mm is drawn parallel to the ordinate and a half-line Mp is constructed which forms an angle • with Mm, so that tan g = 2. This half-line meets the experimental curve at P. N is found as

744 JOURNAL OF THE SOCIETY OF COSMETIC CHEMISTS •s y qnpbob½ ' Figure 27.--Graphical determination of dilatometric curve. the intercept of the line parallel to the abscissa drawn through P and Mm. •O is found next since NM = N. R. The line through • parallel to the ab- scissa is the asymptote sought. The ends of the experimental graphs are not always absolutely hyper- bolic. However, the difference between the experimental asymptote and the theoretical asymptote is only slightly in error.
Purchased for the exclusive use of nofirst nolast (unknown)
From: SCC Media Library & Resource Center (library.scconline.org)