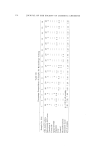
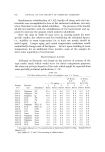
SOLUBILIZATION OF BACTERIOSTATS 179 U.S.P. peptone. The broth was tubed in 8.9 mi. amounts, capped with aluminum caps, and sterilized by autoclaving at 121øC for twenty minutes. One-ml. amounts of each sample dilution were added to each of four tubes of broth. Three of these were each inoculated with 0.1 ml. of a twenty-four-hour nutrient broth culture of Staphylococcus aureus ATCC No. 6538. The fourth tube was not inoculated and served as a sample sterility control as well as a sample turbidity control. Two sets of four culture controls were prepared. For these 1 ml. of water was added to each tube in each set. The uninoculated tube from the one set of these culture control tubes was used as a reference tube for standardizing a Coleman Junior spectrophotometer. The instrument was standardized at 80% transmittance at a wave length of 580 m•. The transmittance of each of the tubes containing the various test dilutions was determined immediately after the addition of the inoculum. Tests prepared from samples H-3/12 through H-3/16 were shaken continually from the time of the addition of the test dilution until removal from the incubator. Tubes were removed individually from the shaker in order to determine transmittance. All tubes were incubated for twenty-four hours at 37øC, and transmittances were then redetermined. One set of culture control tubes was shaken during incubation, and the other set was not. In order to determine more precisely minimal amounts of growth in the culture tubes and to detect any decrease in the inoculum during the twenty-four-hour exposure of the inoculum to the test materials in broth, plate counts were made of all tubes showing little or no change in turbidity during incubation. After making the final transmittance readings the three inoculated tubes in each set were pooled, and appro- priate aliquots were plated with trypticase soya agar (BBL). The plates were incubated for twenty-four hours at 37øC and the developed colonies counted. The population of the original inoculum was determined by plate count at the time of inoculation of the culture tubes. Plate counts were also made of the culture control tubes and the surfactant control tubes (sample H-3/11). For brevity, transmittance measurements and plate counts are not shown in this paper, but they may be obtained from the authors upon request. Results are summarized in Tables V and VI. In evaluating the tests on the basis of turbidimetric changes only, net transmittance changes up to 10% of the change in the culture control are considered to indicate complete inhibition of growth. Changes in net transmittance over 50% of that of the culture control tubes are

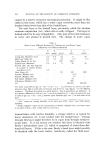
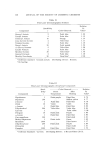
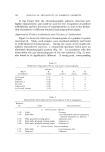
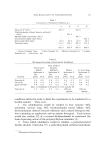
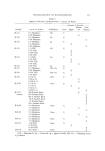
180 JOURNAL OF THE SOCIETY OF COSMETIC CHEMISTS considered to indicate too little inhibitory activity to have any practical significance. These net transmittance changes are arrived at by deter- mining the average decrease in transmittance of the three inoculated tubes of each set and correcting this by subtracting any decrease in transmittance of the sample control or by adding any increase in transmittance of the sample control. Degrees of inhibition of growth as indicated by the changes in transmittances are shown in Table V. Decreases in the initial population present in the culture tubes con- taining various concentrations of the test materials as determined by plate counts are shown in Table VI. 3. Calf skin substantivity test (Stecker Chemicals, Inc.). For pur- poses of this test, fresh calf skin was obtained from the flank area before any curing procedure such as salting or pickling had been done. The skin was prepared for the test by shaving the epidermis and defleshing the flesh side. The shaving operation involved the use of no soap or other shaving assistants. The original samples were diluted before testing to give a concentra- Table VI Per Cent Decrease in Population, Nutrient Broth, S. Aureus, 24 Hours , -p.p.m. of Diaphene- , Sample Solubilizer a 2.0 1.0 0.5 0.25 H-3/1 NS 99.99% 96.6 % Increase H-3/2 Tw 99.6 % 99.8% Increase H-3/3 Ig 100.0% 99.2% Increase H-3/7 NS(q-L) 100.0% 91.2% Increase H-3/12 None 100.0% Increase ... H-3/13 None 100.0% Increase . . . H-3/14 None 99.5 % Increase . . . ---p.p.m. of TCC- 1.5 0.75 0.375 H-3/4 NS 63.3% 22.1% Increase H-3/5 Tw 65.9 % 42.5% Increase H-3/6 Ig 95.3% 99.8% 99.9% H-3/8 NS(q-L) 71.2% 64.6% 20.4% H-3/15 None 82.7% 47.8% . .. p.p.m. of Hexachlorophene- 1.0 0.5 0.25 0.18 ß . . ß . . 96.5% Increase ß . . O. 125 H-3/9 (NS) Increase ... H-3/10 None 79.8% Increase a NS = Nimcolan S, Tw = Tween 80, Ig = Igepal CO-630, NS(q-L) = Nimcolan S and 1.0% Lantrol.
Purchased for the exclusive use of nofirst nolast (unknown)
From: SCC Media Library & Resource Center (library.scconline.org)