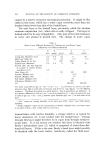
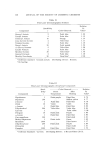
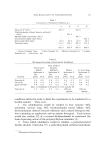
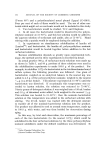
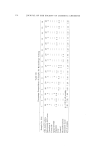
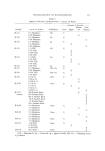
SOLUBILIZATION OF BACTERIOSTATS 181 tion of 0.1% bacteriostat in each. The control sample, H-3/11, was diluted 1:10. The shaved skin samples were placed on glass plates, and the diluted composition tested was applied to the epidermis side, massag- ing it into the skin lightly for a period of ten seconds. After this mas- sage, the sample was allowed to remain on the skin for a period of one minute, after which it was removed first by wiping and then by rinsing in cold clear water. Rinses were accomplished by letting clear cool water pass over the skin pieces (after treatment with the samples) in a running water bath for thirty seconds, and references to two and four rinses involve removal of the test pieces, allowing them to drip for one minute and reimmersing them. Test pieces, 12 mm. in diameter, were removed from the skins using a cork borer of the appropriate size. Test pieces were taken after one, two and four rinsings as described above. Three pieces from each rinsing period were placed on nutrient agar plates seeded with Staphylo- coccus aureus from a twenty-four-hour old culture, with epidermis side in contact with the agar. After incubation for twenty-four hours at 37øC, the results were read as zones of inhibition in millimeters. Other test pieces taken after two and four rinses were held in a room temperature-85% relative humidity chamber for periods of twenty-four and seventy-two hours before placing them on seeded agar plates for the zone of inhibition determination. All tests were done in triplicate, and all readings are based on the average of these three readings to the nearest 0.5 ram. The results are shown in Table VII. DISCUSSION AND CONCLUSIONS Solubi•ization The study was not designed with sufficient variables to yield solu- bilization data subject to physical chemical interpretation, but several interesting observations may be made from the data in Table II. First, it is apparent that a practically useful percentage of each of the bacteriostats can be solubilized in each of the four surfactant solutions by the aid of any one of the three nonionics. Each of the nonionics brought about the solubilization of a greater amount of Diaphene than of TCC in each surfactant solution. The efficiency of a given nonionic for solubilizing a given bacteriostat varied from one surfactant system to another, but the three nonionics did not all show maximum efficiency in the same surfactant solution.

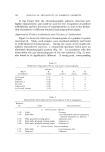
182 JOURNAL OF THE SOCIETY OF COSMETIC CHEMISTS Simultaneous solubilization of 1.0% lanolin oil along with the bac- teriostats was accomplished in two of the surfactant solutions, but only when Nimcolan S was the added solubilizer. The presence of the lanolin oil did not interfere with the solubilization of the bacteriostat and ap- peared to increase the amount which could be solubilized. Since the data in Table II may serve as starting points for more specific studies, the criterion used for establishing the tabulated figures, i.e., stability at room temperature for at least one month should be noted again. Longer aging and varied temperature conditions would undoubtedly change some of the figures. In fact, upon standing at room temperature for an additional three months, some of the samples do show some separation of bacteriostat. Bacteriological Activity Although no literature was found on the activity of systems of the type under study which would serve for direct comparison purposes, the observed activity found is of the order which might be expected from some partially pertinent publications (7-10). Table VII Calf Skin Substantivity, Zones of Inhibition (min.), S. Jureus Sample Bacterio- No. •' stat Solubilizer b 24 Hours, 72 Hours, R.T., R.T., ,-- No Aging- • 85% R.H. 85% R.H. 1 2 3 2 4 2 4 Rinse Rinses Rinses Rinses Rinses Rinses Rinses H-3 H-3 H-3 H-3 H-3 H-3 H-3 H-3 H-3 H-3 H-3 H-3 H-3 H-3 m3/15 H-3/16 /1 Diaphene NS 10.5 8 /2 Diaphene Tw 8.0 8 /3 Diaphene Ig 10.0 8 /4 TCC NS 7.0 4 /5 TCC Tw 8.0 4 /6 TCC Ig 10.0 4 /7 Diaphene NS(+L) 8.0 8 /8 TCC NS(q-L) 7.5 4 /9 O-ll (NS) 6.5 5 /10 G-11 None 6.5 5 /11 None None 2.0 0 /12 Diaphene None 5.5 5 /13 Diaphene None 6.0 5 /14 Diaphene None 7.0 5 TCC None 5.5 4 TCC None 6.0 4 .5 8.0 8.0 8.0 8.0 .0 8.0 8.0 8.0 8.0 .5 8.0 8.0 8.0 8.0 .0 3.0 0.0 0.0 0.0 .0 3.0 0.0 0.0 0.0 0 3.0 0.0 0.0 0.0 0 8.0 8.0 8.0 8.0 5 3.0 0.0 0.0 0.0 0 8.0 0.0 0.0 0.0 0 8.0 0.0 0.0 0.0 0 0.0 0.0 0.0 0.0 0 5.0 5.0 5.0 5.0 5 5.5 5.0 5.0 5.0 5 5.5 5.5 5.0 5.0 0 2.5 0.0 0.0 0.0 0 3.0 0.0 0.0 0.0 8.0 8.0 8.0 0.0 0.0 0.0 8.0 0.0 0.0 00 00 50 50 50 00 00 a All samples diluted to 0. 1% concentration of bacteriostat before testing. diluted 1-10. b See Tables IV, V and VI for meaning of abbreviations. Sample H-3/11
Purchased for the exclusive use of nofirst nolast (unknown)
From: SCC Media Library & Resource Center (library.scconline.org)