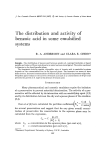
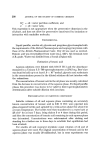
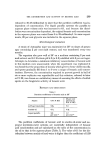
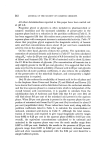
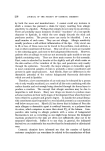
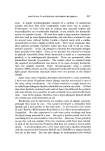
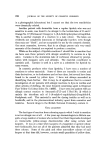
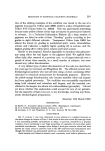
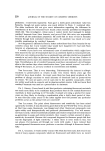
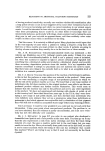
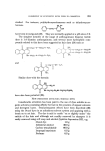
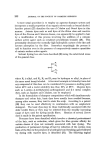
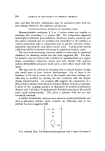
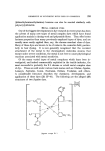
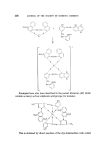
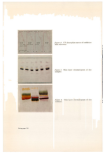
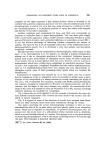
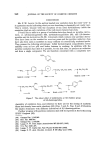
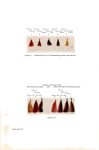
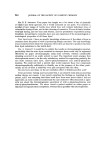
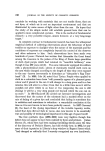
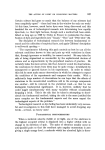
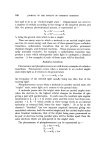
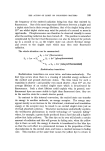
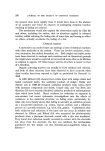
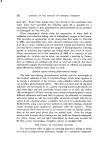
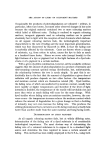
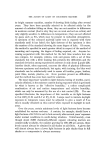
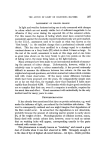
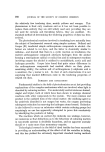
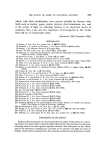
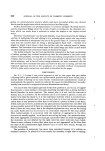
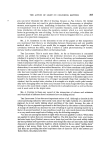
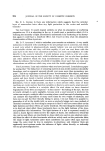
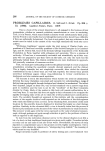
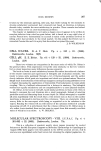
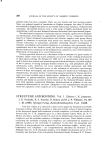
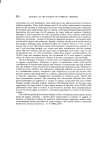
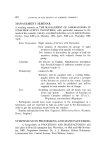
Figure 4 UV absorption curxes of oxidation base mixtures. Figure 5 Thin laver chromatogram of dye samples. Figure t Thin layer chromatogram of dye extracts. lacing page 241

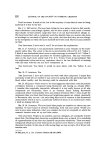
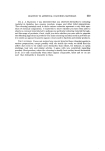
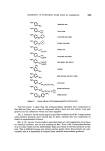
CHEMISTRY OF SYNTHETIC DYES USED IN COSMETICS 241 examples on the right represent a hair dyeing mixture which is intended to be oxidised with a peroxy compound, and show very few coloured oxidation bases. If the chromatography is carried out, as in this case, using Kieselgel G, a substrate of silica gel containing gypsum, it is physically possible to spray the plates with reagents and thereby reveal other compounds. Another technique used occasionally for dyes, and tried very occasionally on mixtures of oxidation bases is paper electrophoresis. This was done quite simply with a home-made apparatus, using a buffer solution containing 50 parts of acetic acid and 50 parts of water, and a potential difference of somewhere around 350 v. It has the distinct advantage of indicating whether compounds are anionic or cationic. The spots in Fig. $ are all examples of hair dyes of the substituted nitroop- phenylenediamine variety. No. 2 is obviously a very bad sample, and has almost completely oxidised. Having separated coloured compounds by chromatography, either paper or thin layer, or by electrophoresis it is our practice to attempt a definite identification making use of the uv absorption spectrum of the compound. Oxidation bases in general tend to give quite simple uv absorption curves, many of which consist just of two peaks, such as p-amino-phenol there are a few, however, such as 1-amino-4- sulphophenol, which have a rather more complicated uv absorption structure. There are also a few compounds, 1-naphthol, 2-naphthol and the various naphthalenediols, such as 1:5 naphthalenediol, which have very elegant and very characteristic uv absorption curves, some of them possessing sharp spikes which are excellent for identification. Examination of oxidation base samples by uv is very useful, and Fig. 4 shows that by making use of the uv absorption curve it is possible, in simple cases, to get a measure of the composition of a binary mixture by merely examining the shape of the curve. Fig. • represents four mixtures, starting with 50/50 p-phenylenediamine and catechol, changing in composition to 80 parts of p-phenylenediamine and 20 of catechol, and the shape of the curve changes very rapidly. By examination of the shape of the curve it is possible to make an estimation to 2 or $% accuracy assuming standard mixtures are available for comparison. Fig. 5 shows the use of tic applied to six dye samples of nominally the same dye from different manufacturers. One of them has been shaded with another blue dye which is clearly separated. Fig. 6 is typical of some of the mixtures of textile dyes stripped from fibres. These are three mixtures taken from three commercial dyeings on cotton. One point concerning the actual chromatography technique is that we have abandoned the idea of tic on glass plates, and now usually prefer to use aluminium plates, which can be regarded as expendable. To preserve chromatograms they are pressed into the sticky layer of a self-adhesive sticky material Such as Itlebefolie, which is a book binding material, or CoverIon. This appears to be a very good method of preserving chromatograms, even to the extent of enabling them to be sent through the post. This technique is described elsewhere (48). (48) J. Soc. Dyers Colo•ists 8:1. 161 (1965).
Purchased for the exclusive use of nofirst nolast (unknown)
From: SCC Media Library & Resource Center (library.scconline.org)