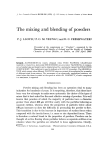
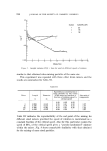
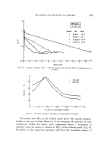
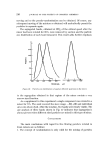
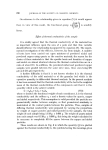
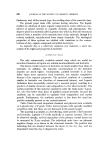
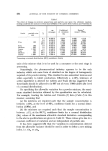
SAMPLING AND ASSESSMENT OF POWDER MIXTURES 263 xy/ M Y(•"fw) x 4-X(•-fW)y where 5[ is the mass of the sample taken from the mix and Efw is the effective mean particle weight of mix component. Amongst the indices proposed, mention might be made here of s/o R as used by Poole et al (the reciprocal was also used by Lacey) and of that proposed by Ashton and Valentin (7). 2 log s2 log % A2 : 2 log 2 log c• o c• R It is usually assumed that sample concentrations obey the normal distribution law and that a sufficient number of samples are taken to correctly estimate the true standard deviation of sample concentrations. Since the condition of the randomized mixture is used as the basis for assessing the degree of mixing that has been attained, it is necessary to examine the properties of the randomized mixture. This reveals that the standard deviation of sample concentration depends on the number of particles taken in the sample, or, for a given sample weight, on the particle,- size distribution of the two ingredients and also on the proportions of these ingredients. Ashton and Valentin (7) calculated the effect of change in mixture proportions and particle size upon the ultimate randomized mix condition for mixtures of fine sand (160[tm) •vith calcite (Table I). From Table I it is evident that the coefficients of variation theoreticall 3, attainable decrease •vith increasing concentration of the minor ingredient and with decreasing particle size. Randomized mixtures of coarse particles containing a very small proportion of the minor ingredient cannot really be described as being very homogenous and it might be expected that randomization might be relatively easy to bring about in such a case. The results of Ashton et at (7) in the rate of mixing tend to confirm this finding (Figs. 1 and 3). Since mixing indices based on the randomized state are dependent upon the particle properties of the mixed po•vders as well as the proportions present, an index independent of such parameters might offer a better solution in describing the homogeneity of a powder mixture. Such an index may be based upon some standard specification. When examining powder mixtures as to the variation of sample con- centration, the sample size or scale or scrutiny is established by the smallest

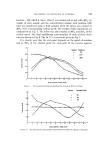
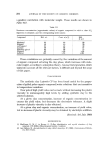
264 JOURNAL OF THE SOCIETY OF COSMETIC CHEMISTS Table I The effect of change in mixture proportions and particle size upon the ultimate random- mixing condition for mixtures of fine sand (160gin) with calcite from Ashton and Valentin (7) Calcite ..... (• Coefficient Range* (Stange) of variation mean + 1.96(•R Grade particle size •o (%) 0.1 0.005 2 5.200 0.090 0.110 1.0 0.016 4 1.640 0.968 1.032 Fine 155 10.0 0.049 6 0.496 9.903 10.097 50.0 0.084 0 0.168 49.830 50.160 Fine 155 1.0 0.016 4 1.640 0.968 1.032 Medium 335 1.0 0.050 3 5.030 0.901 1.099 Coarse 1 200 1.0 0.342 0 34.200 0.330 1.670 Fine 155 50.0 0.084 0 0.168 49.830 50.160 Medium 335 50.0 0.190 0 0.380 49.630 50.370 Coarse 1 200 50.0 1.222 0 2.440 47.600 52.400 *assuming a normal distribution (95 •o confidence limits) unit of the mixture that is to be used by a consumer or the next stage in processing. Surprisingly, the pharmaceutical industry appears to be the only industry which sets some form of standard on the degree of homogeneity required of its powder mixing. This standard is also somewhat tenuous and refers especially to tablet production. Effectively a + 10% tolerance of active ingredient is allowed for tablets and Train (4) has suggested that these limits should be adhered to in 997 out of every 1 000 tablets (3• level of a normal distribution). By specifying the allowable variation for a powder mixture, the maxi- mum standard deviation allowed by the specification can be calculated. For example, treating the Ashton and Valentin (7) data (Table I) in this manner, assuming that {a) the mixtures are required such that the sample concentration is between + 10% at the level of 95% confidence limits for a normal distri- bution (1.96•), and {b) the mixtures are required such that the sample concentration is between + 1% at the 99.7% confidence limits for a normal distribution (3•), values of the maximum allowable standard deviation corresponding to the above specifications are given in Table II. These values give rise to a constant coefficient of variation and are independent of particle size. It has been suggested (8) that the variation in concentration derived from the allowable variance should be used in order to define a new mixing index, i.e. s/• A or s/%
Purchased for the exclusive use of nofirst nolast (unknown)
From: SCC Media Library & Resource Center (library.scconline.org)