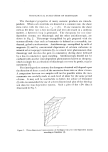
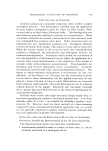
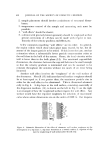
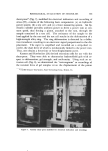
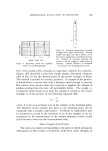
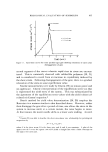
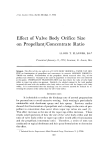
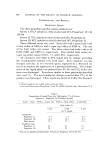
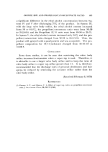
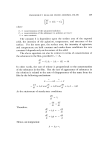
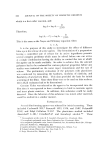
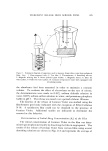
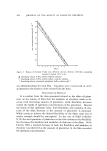
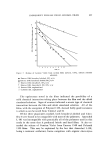
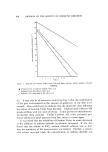
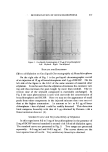
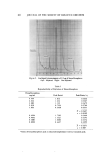
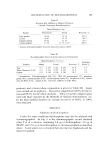
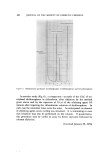
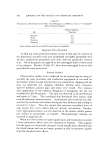
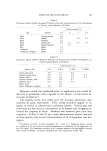
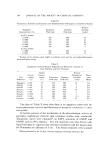
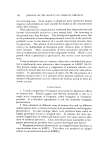
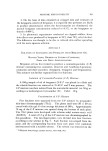
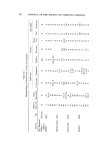
RHEOLOGICAL EVALUATION OF SEMISOLIDS 655 PISTON TRAVEL [IN.) Figure 9. Extrusion curves for replicate 3.0% w/w purified agar gels Figure 10. Schematic illustration of tensile strength device [after Charm (34)]. Product sample with glass tube (B) is forced out of the tube by application of uniform pressure (A). Column of extruded material (C) reaches a critical weight at which point it separates. Column diameter is measured just prior to the breaking point at (D). feel, of the product (25)--certainly an important criterion for cosmetics. Charm (26) described a relatively simple system, illustrated schemati- cally in Fig. 10, for the determination of the tensile strength of fluids. The method is suitable for cosmetic products. If a sample of the product is forced down a vertical tube with a diameter small enough to prevent flow unless a force greater than that of gravity is applied, the column of product exiting from the tube will periodically break. The weight, w, of material which breaks away from the column is related to the tensile strength, St, of the product by the following equation (26)' & - .4' where A is the cross-sectional area of the column at the breaking point. The diameter of the column just prior to the breaking point can be measured with a suitable cathetometer. Problems in replicability may be incurred as a result of the inclusion of air in the samples or by ira- preciseness in the measurement of the column diameter (which would yield incorrect values for the cross-sectional area). Shear Strength (Yield Value) The stress on a system corresponding to the point at which permanent deformation or flow results is termed the yield stress, shear strength, or

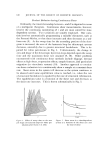
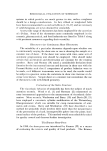
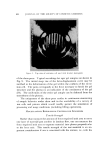
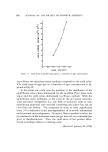
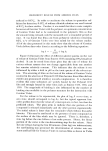
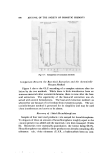
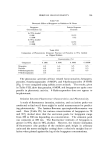
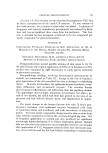
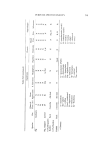
656 JOURNAL OF THE SOCIETY OF COSMETIC CHEMISTS yield value of the system. Two useful approaches to shear strength de- termination are those of Pryce Jones (27) and Bruss (28, 29). Pryce Jones attempted to characterize thixotropic systems by rotating the inner cylinder of a Couette rheometer through a certain angle, re- leasing the cylinder, and then noting the rate of its return to its original position. When the sample in the gap had a gel strength of zero, the inner cylinder returned to its original position. A finite deflection of the rotor was indicative of structure formation and the extent of deflec- tion, of gel strength. A similar procedure was utilized in our labora- tories with the Rotovisco to permit measurements of gel structure and gel strength. In all instances, the SV-II "profiled" (ribbed) rotor-and-cup assembly was employed in conjunction with a ZG-100 gear reducing box to reduce the rate of rotation by a factor of 100. After attachment of the coverplate and rotor to the spindle of the Rotovisco measuring head, 9.5 ml of an agar sol were pipetted into the SV cup. The cup was im- mediately pushed up around the rotor and secured in place. Drops of water were placed on the coverplate and Saran wrap was taped in place around the entire measuring system and temperature control assembly to prevent drying out of the gel sample during the time allotted for its maturation. At the conclusion of the aging period, the gear shift lever was engaged at the lowest gear selection setting, i.e., 162, for exactly 10 minutes and the rate of stress increase in the system was noted. Time intervals longer than ca. 10 minutes permitted the development of stress to levels beyond the capability of the Rotovisco measuring head em- ployed (500 g cm torque limit) intervals of less than 10 minutes did not result in stress values which were in the more accurate range of the mea- suring system. Preliminary studies had shown none of the gels to un- dergo rheodestruction within a 10-minute period. The gear was dis- engaged after 10 minutes and the relaxation of stress in the system was noted. Eventually, a point was reached at which no further relaxation occurred. Stress-time data were obtained for agar gels up to concentra- tions of 4.0% w/w. Typical stress-time curves are shown in Fig. 11. Prior to the disengagement of the gear, the stress-time curves are characterized by two distinct linear portions. Stress in the system ini- tially increases at a relatively slow rate. After about 9 to 10 minutes, a marked increase in stress is encountered. The first segment of the biphasic curves could be an artifact--this seems likely as agar gels of dif- ferent concentration differ little from one another in initial stress de- velopment in this system. The differences in the samples arise in the
Purchased for the exclusive use of nofirst nolast (unknown)
From: SCC Media Library & Resource Center (library.scconline.org)