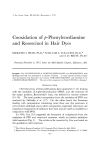
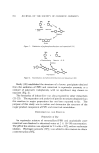
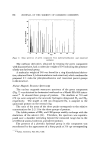
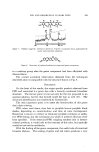
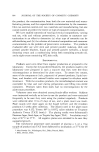
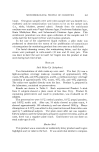
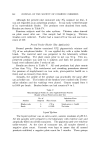
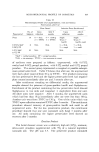
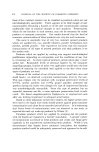
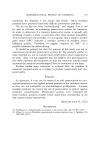
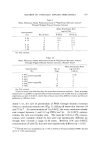
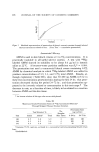
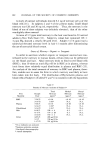
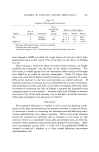
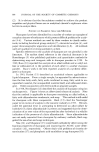
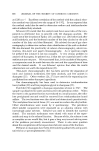
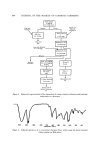
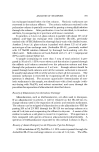
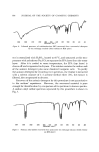
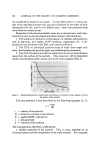
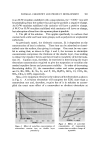
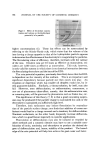
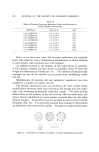
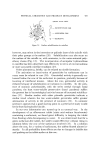
856 .1OURNAL OF THE SOCIETY OF COSMETIC CHEMISTS These solutions were tBrther purified by repeated elutions on analytical tic plates. In spite of all the precautions, some nonmoving residue was always present or formed on the silica gel, demonstrating the inherent instability of the dyes. Column Chromatography Coluinn chromatography (acidic silica gel) was used only for the pre- liminary enrichment of the components in large amounts for the subse- quent thin-layer separation. In column chromatography, component trailing occurred to a greater extent than on the preparative plates. Structure Elucidatzon The major component which was resolved sharply during chromato- graphic separation was green and showed medium mobility (R• 0.3-0.4) on silica gel with the solvents mentioned above. The isolated sample was a very dark green crystalline material. The analytical work in- volved for identification of this component is described below. Ultraviolet and Visible Spectra The ultraviolet spectrum of the aqueous solution of this dye showed a bathochromic shift of the 190-mt• and 242-rest bands to 203 and 276 m/•, respectively (Fig. 3), at alkaline pH. This shift is commonly asso- ciated with the presence of phenolic hydroxyls (24). Figure 3. ,.0[• __ ,.: •.0 [• eepH: 2.0 200 250 300 350 Wavelength (millimicrons) Effect of pH on uv spectrum of green component from p-phenylenediamine and resorcinol oxidation The presence of amino groups was indicated by the hypsochromic shifts of the 420-mt• and 600-mt• bands to 380 and 560 mt•, respectively (Fig. 4), when the pH of the solution was lowered to 2.

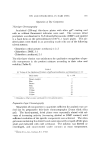
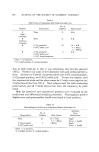
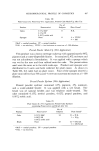
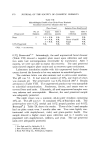
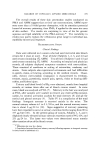
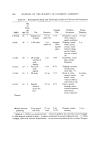
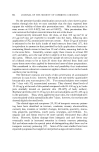
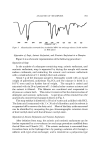
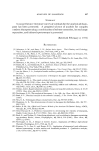
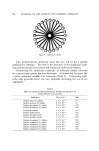
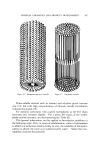
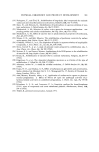
PPD AND RESORCINOL IN HAIR DYES 857 0.5 3•8 2 pH=8 400 500 600 700 Wavelength (millimicrons) Figure 4. Effect of pH on visible spectrum of green component from p-phenylenediamine and resorcinol oxidation Figure 5. Wavelength (microns) 3 4 5 6 7 8 10 20 1.o• 4000 3000 2000 1000 Frequency (cm -• ) Infrared spectrum of green component from p-phenylenediamine and resorcinol oxidation Infrared Spectrum The infrared spectrum (Fig. 5) was obtained using the KBr pellet technique. The absorption bands at 3420, 3330, and 3175 cm -• indi- cated the presence of amino groups. The phenolic hydroxyl could not be positively identified from the spectrum because the characteristic C-H and N-H stretching frequency bands are very strong in the 3600-2900 cm -• region. The strong absorption peak at 1630 cm -• was indicative of the quino- noid structure. Mass Spectroscopy The molecular weight of 320 for the component was determined by mass spectrometry. The even mass number confirms the presence of an even number of nitrogen atoms in the molecule (25). The fragmentation pattern was too complex to allow an accounting of all the species, but fragments such as aniline (m/e 93), phenol (m/e 94), phenylenediamine (m/e 108), and dihydroxybenzene (m/e 110) were clearly recognized (Fig. 6).
Purchased for the exclusive use of nofirst nolast (unknown)
From: SCC Media Library & Resource Center (library.scconline.org)