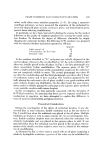
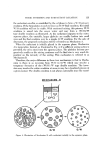
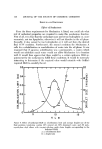
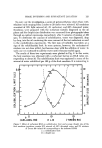
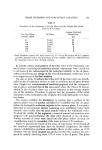
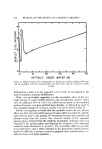
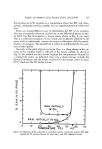
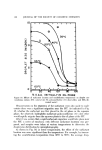
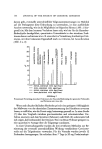
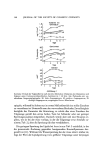
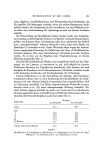
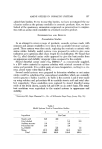
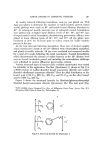
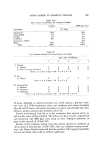
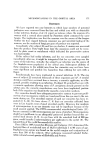
PHASE INVERSION AND SURFACTANT LOCATION 131 The two oils selected for this series of experiments were: mineral oil, which has relatively poor solubility for Tween 80 and oleyl alcohol in which the surfactant has good solubility. Emulsions were prepared with varying initial surfactant locations and the droplet size distributions were measured from microphotographs obtained for each emulsion after 5 min of mixing. The result showing the effect of initial surfactant location on the average droplet size for mineral oil system is shown in Fig. 8. The abscissa indicates the percentage of the total Tween 80 initially placed in the aqueous phase. The nearly flat curve indicates that the effect of the initial surfactant location on the droplet size of the final O/W emulsion is a minor one. Because of the poor oil solubility of Tween 80, the effect of Mechanism A is not pronounced. In the oleyl alcohol system, the surfactant is completely soluble and, as represented by Fig. 9, the emulsion had the smallest average droplet size when all the surfactant was placed in the oil phase. It appears that Mecha- nism A was controlling the emulsification near the left end of the curve the droplets were quite small. Gn the right, where •lechanism A was not al- lowed to function, the droplets were large and the finished emulsions were unstable. If there are indeed two separate mechanisms, it should be possible to find a point somewhere between the two extremes where both mechanisms •0 i [ I I I n,,' - •: - ,,,lO -- ..,.. Ct• - I. tJ -- 0 [ I I I I I I I l 0 20 40 60 80 I00 %TWEEN 80 IN AQUEOUS PHASE Figure 9. Effect of initial suffactant location on the droplet size of oley] alcohol emulsions (30% oleyl alcohol emulsified with 5% Tween 80)

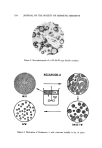
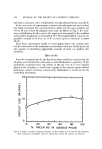
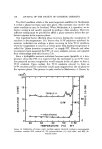
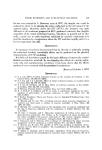
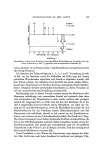
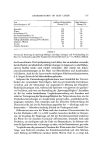
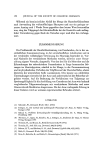
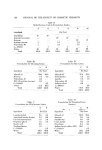
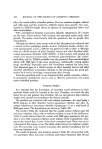
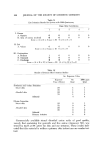
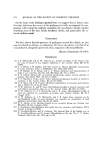
132 JOURNAL OF THE SOCIETY OF COSMETIC CHEMISTS 13. o i:• o 4" I 2012 I00 i i I i I I I I i I i 0 2 4 6 8 I0 12 DROPLET SIZE {'MICRON) Figure 10. Droplet size distribution of an emulsion prepared with % suroeactant initially in oil and % in aqueous phase (emulsion contains 30% mineral off, 5% polyoxyethylene (6) oleyl ether, and 65% deionized water) are functioning. A droplet size determination of such an emulsion would also reveal the operation of these two mechanisms. An example of a droplet distribution curve for an emulsion initially pre- pared with half surfactant in mineral oil and half in water is shown in Fig. 10. The two peaks in the distribution curve appear to indicate that droplets were derived from two separate origins. E#ects of Preparative Methods In addition to studying the effects of changing surfactants and oils, the ef- fects of changing the manufacturing methods, while keeping the formula con- stant, were also investigated. It was reasoned that any process variables intro- duced in preparing the emulsion which adversely affected any of the three conditions would also cause the formation of a coarser emulsion. Conversely, variables which favorably affected any of the conditions for Mechanism A would help to produce a finer emulsion. One of the three conditions is that the hydrophilic surfactant must be ini- tially dissolved in the oil phase. When a mixture of 5% Tween 80-Ariaeel 80 (4:1) was dispersed into the 30% oil phase, a turbid solution was obtained. However, it was discovered that if a small amount of water was mixed into this dispersion, a clear solution could be obtained.
Purchased for the exclusive use of nofirst nolast (unknown)
From: SCC Media Library & Resource Center (library.scconline.org)