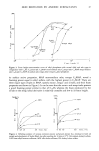
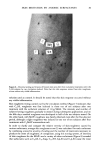
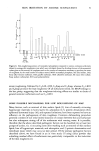
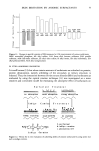
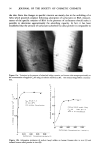
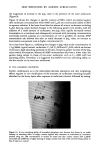
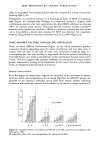
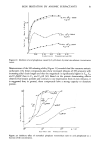
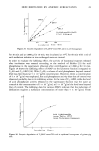
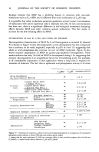
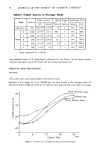
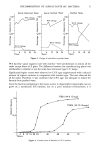
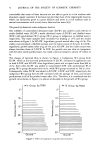
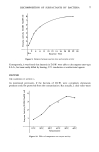
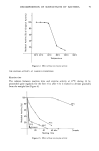
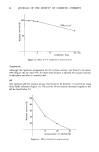
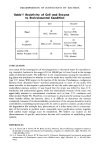
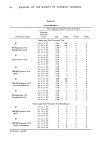
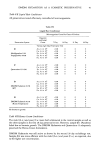
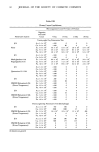
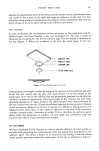
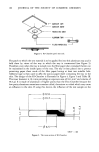
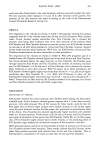
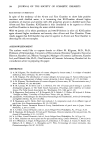
DECOMPOSITION OF SURFACTANTS BY BACTERIA 71 100- Sterile Deionized Water . 100 • 50- W-13 Group • 1•2 1•8 2•4 Hours Sterile Distilled Water Distilled Water 100- W-13 Group • 1•2 118 2•4 Hours 8 o D_ D_ 50- W-13 Group W-6 Group • (2 1•8 2•4 Hours Figure 3. Change of microflora in purified water W-6 bacteria--gram negative rods with motility--were predominant in almost all the tanks except those of E plant. The difference between the manufacturing plants was attributable to whether or not the tanks have immersed type U.V. lamps. Significantly higher counts were observed on C.P.S. agar supplemented with a reduced amount of organic nutrients in comparison with nutrient agar. This was observed for all the tanks. Therefore, it was confirmed that C.P.S. agar was adequate to isolate the bacteria from purified water. Since the bacteria multiplying in the water, survive in oligotrophic (oligotrophs can not grow on a nutritiously rich medium, but on a poor medium) environments, it is 1.0- 0.5- Hours 77801 (W-6 Group) - '2 ' ' 1 l b'02'4' 3'6 ' ' 4'8 ' ' ' Figure 4. Growth curve of bacteria in C.P.S. medium

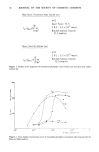
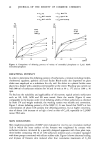
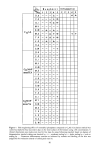
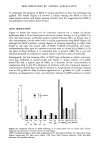
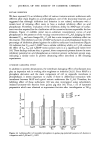
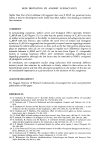
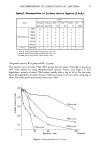
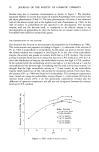
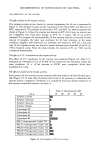
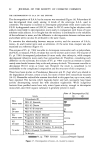
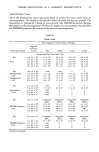
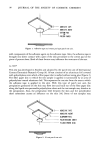
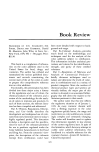
72 JOURNAL OF THE SOCIETY OF COSMETIC CHEMISTS conceivable that some of these bacteria are not able to grow in a rich medium with abundant organic nutrients. It has been reported that most of the oligotrophic bacteria which can exclusively grow in a poor medium and never in a rich medium exist in natural environments such as soil, rivers, lakes and sea water (8,9). The growth of aleionized water indigenous bacteria One milliliter of nonsterilized deionized water (D.I.W.) was added to each 100 ml of sterile distilled water (S.D.W.), sterile deionized water (S.D.I.W.) and distilled water (D.W.) with predominant W-13 group (W-13 group is indigenous to distilled water.), respectively. The water samples were incubated by shaking at 25øC and the results were shown in Figure 2. In S.D.I.W., logarithmic growth started after a lag of 4 hr. The viable counts attained a 200-fold increase over the initial counts 20 hr later. In S.D.W., logarithmic growth started after a lag of 4 hr as in S.D.I.W., but the viable counts were always less than those of S.D.I.W. In D.W. the growth rate was slow in comparison with the other sterile purified water, but viable counts increased to almost 106 within 24 hr. The change of bacterial flora is shown in Figure 3. Indigenous W-6 group from D.I.W., which at first survived predominantly in D.I.W., increased its appearance rate in both S.D.W. and S.D.I.W. from logarithmic phase and occupied more than 90% in 24 hr. Even when D.I.W. was added to nonsterilized D.W. with predominant W-13 group, W-13 group decreased after 10 hr, while W-6 group increased to 70% in 24 hr. Consequently, when D.I.W. was added to S.D.I.W., S.D.W. and D.W., respectively, the indigenous W-6 group from D.I.W. increased with the passage of time, and became predominant in all of the purified waters after 24 hr. Therefore, it is considered that the growth curve shown in Figure 2, is almost attributable to the growth of W-6 group. 10 ø- 15 ø- 20 ø 25 ø - 30 ø- W-6 Group Sp.77801 10 ø • 20 ø- 25 ø - ) 30 ø-- Growth Growth W-13 Group Sp.77604 Figure 5. Effect of temperature on growth rate of bacteria
Purchased for the exclusive use of nofirst nolast (unknown)
From: SCC Media Library & Resource Center (library.scconline.org)