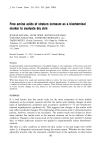
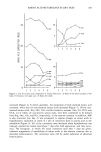
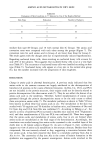
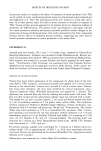
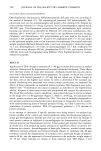
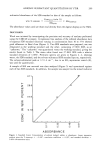
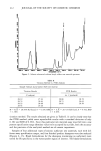
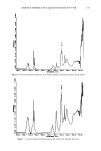
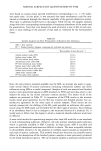
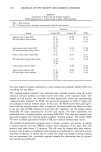
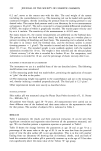
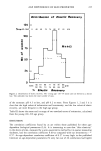
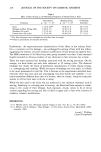
EFFECTS OF IRRITANTS ON SKIN 201 0.1 I I 100 DOSE OF ANTHRALIN (•g) Figure 2. Effect of increasing doses of anthralin on epidermal protein synthesis. Animals were treated with anthralin in 0.2 ml of acetone as described in the Experimental section. Twenty-four hours later, skin fragments were pulse-labeled with 35S-methionine for 4 hours. Protein synthesis was assessed by the incorporation of radiolabel into the acid-insoluble material of the epidermal cells. Table I Ability of Skin Irritants to Inhibit Protein Synthesis in Mouse Epidermis Sample a (Dose) Protein Synthesis (% Control) b Control Anthralin (80 Ixg, 354 nmol) Benzoyl peroxide (40 mg, 165 Ixmol) TPA (10 Ixg, 17 nmol) 100 22 115 63 a Mice were treated with irritants in 0.2 ml of acetone 24 hours before labeling with 35S-methionine as described in the Experimental section. Control animals received 0.2 ml acetone alone. Each point represents the mean of at least four experiments. b Protein from extracts was precipitated with 3 ml of 10% (w/v) ice cold trichloroacetic acid (TCA). After rinsing with TCA (2 X 3 ml), precipitates were collected on filter paper and radioactivity determined on a scintillation counter. Control extracts contained 740 cpm per }.tg of protein. reference I3). Autoradiographs of protein gels from benzoyl peroxide-treated epidermis indicated that there was no effect on the synthesis of new proteins. This is not surprising since we also did not observe hyperemia or increased epidermal thickening in mouse skin after benzoyl peroxide treatment (not shown). Since significant changes in epidermal proteins occurred following anthralin treatment, we attempted to further resolve the samples utilizing two-dimensional polyacrylamide

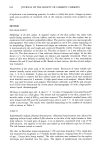
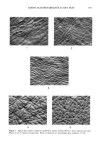
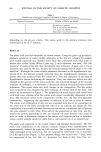
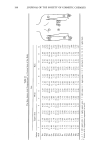
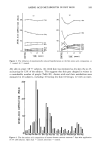
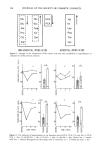
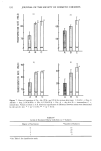
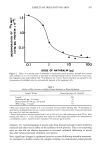
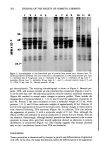
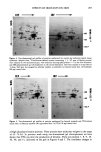
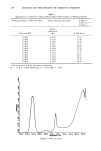
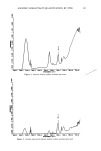
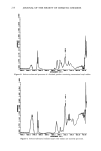
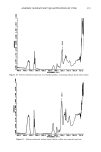
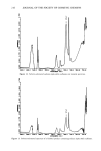
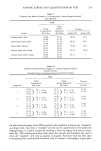
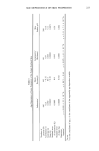
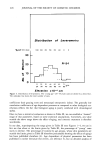
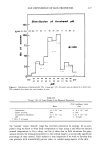
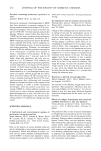
202 JOURNAL OF THE SOCIETY OF COSMETIC CHEMISTS I 2 3 4 5 6 7 8 9 10 11 12 . : :- 93- 25.7- Figure 3. Autoradiograph of one-dimensional gels of proteins from treated mice. Extracts from 35S- methionine-labeled epidermal cells were subjected to electrophoresis on 10% polyacrylamide gels. Lane 1--Anthralin dose of 5 I•g/mouse. Lane 2--Anthralin, 10 I•g. Lane 3--Anthralin, 20 I•g. Lane 4-- Anthralin, 40 I•g. Lane 5--Anthralin, 80 I•g. Lanes 6, 7, and 11--Acetone controls. Lanes 8, 9, and 12--TPA, 10 I•g. Lane 10--Benzoyl peroxide, 40 mg. gel electrophoresis. The resulting autoradiograph is shown in Figure 4. Benzoyl per- oxide, TPA, and acetone controls are also presented for comparison (Figures 4 and 5). It can be seen that over 100 individual proteins could be resolved. Anthralin treatment (Figure 4b) resulted in several major changes in protein profiles. These include the disappearance of proteins labeled 2, 7, 8, 9, and 10 and the appearance of proteins 43 and 46. Protein 2 has been estimated to have a molecular weight of 52 kd, while proteins 7, 8, 9, and 10 have molecular weights of approximately 62 kd. Proteins 43 and 46 were approximately 64 and 56 kd respectively. Similar changes in these proteins were observed following TPA treatment (Figure 5b). In addition, TPA also induced the appearance of protein 51 with a molecular weight of 51 kd. Thus, although the effects of TPA and anthralin on protein production in mouse skin are similar, they are not identical. Interestingly, although benzoyl peroxide has been reported to be a tumor promoter in mouse skin, gels from treated epidermis showed no alteration in protein distribution or production (Figure 5a). This finding suggests that benzoyl peroxide may act by a mechanism distinct from TPA and anthralin. DISCUSSION Tumor promotion is characterized by changes in growth and differentiation of epidermal cells (19). In the skin, the major biochemical marker for differentiation is the appearance
Purchased for the exclusive use of nofirst nolast (unknown)
From: SCC Media Library & Resource Center (library.scconline.org)