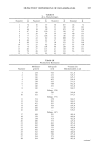
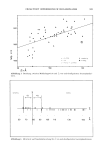
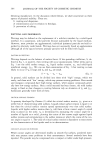
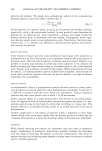
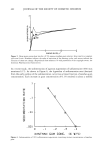
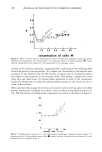
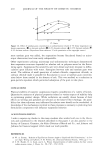
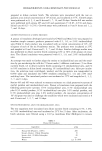
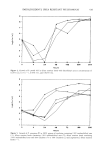
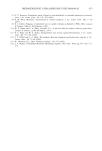
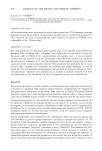
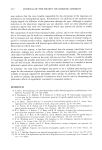
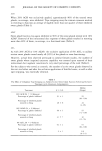
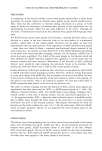
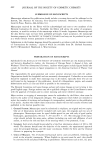
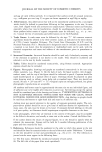
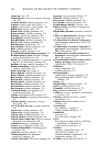
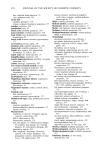
SUSPENSION STABILITY 395 -1.9CM 4 Figure 1. Apparatus for penetration studies. Key: a, packed column in tube b, glass flit c, penetrating liquid d, slit in tube. (Reproduced from reference 4 with permission of the copyright owner, the American Pharmaceutical Association.) and contact angles determined directly with a goniometer (2-4). A second method involves preparing a compact, saturating it with the liquid to be used in the measure- ment and then determining the height of added liquid above the surface of the com- pact (5). Still another method takes advantage of the fact that the rate of penetration into a powder bed is a function of the contact angle. An apparatus used in our laboratory is shown in Figure 1. The Washburn equation, Eq. 2, is used to analyze the data: d 2 F •/LCOSO -- t 2'q (Eq. 2) Here, 0 is the contact angle, d is the distance the liquid has to travel, t is the measured time, v I is liquid viscosity, and • is the average pore radius within the powder bed. A typical set of results is plotted in Figure 2. The value of r can be determined by using liquids whose surface tension is low enough to make the contact angle equal to zero (cos = 1). Once r is known, contact angle values can be calculated directly from Eq. 2. Choosing the liquids to work with can be a problem when the solid is an organic compound of intermediate polarity. (Many drug compounds fall into this category.) Hydrocarbon liquids, which generally have very low surface tensions, may spread so no contact angle can be measured, while semipolar liquids may dissolve some of the solid. We used aqueous solutions of nonionic surfactants since it was possible to prepare solutions with different surface tensions which did not have appreciable solvency for the compounds tested (3,4).

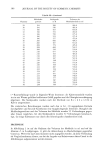
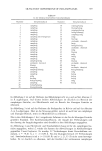
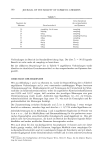
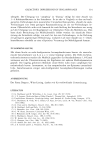
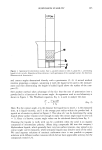
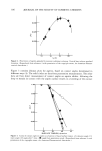
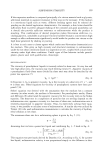
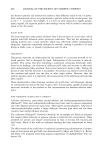
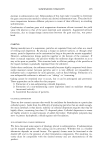
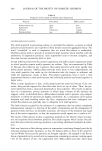
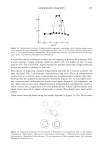
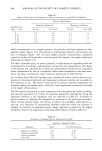
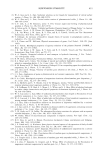
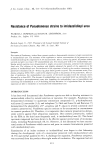
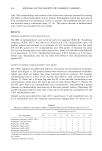
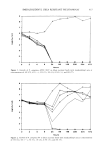
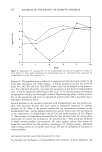
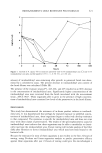
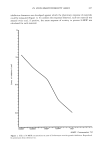
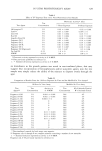
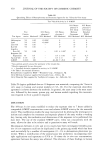
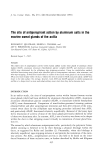
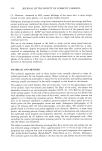
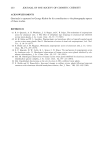
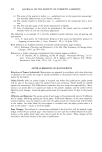
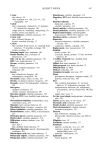
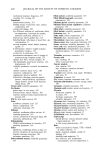
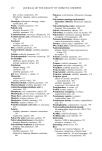
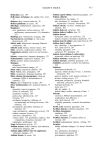
396 JOURNAL OF THE SOCIETY OF COSMETIC CHEMISTS 0.030 0.025 0.020 I I I I 14 16 18 20 •L/2• Figure 2. Penetration of aspirin granules by nonionic surfactant solutions. Vertical bars indicate standard deviation. (Reproduced from reference 4 with permission of the copyright owner, the American Pharma- ceutical Association.) Figure 3 contains Zisman plots for aspirin, based on contact angles determined in different ways (4). The solid circles are data from penetration measurements. The other data are from direct measurement of contact angles on aspirin tablets. Allowing the drop to remain in contact with the aspirin surface results in a lowering of the contact 1.00 -- 0.95 0.90 0.85 0.80 30 35 40 45 SURFACE TENSION, dynes/era Figure 3. Cosine of contact angle on aspirin as a function of liquid surface tension. (/•) dynamic angle (O) static angle ([•) angle after 5 min. (O) angle from penetration study. (Reproduced from reference 4 with permission of the copyright owner, the American Pharmaceutical Association.)
Purchased for the exclusive use of nofirst nolast (unknown)
From: SCC Media Library & Resource Center (library.scconline.org)