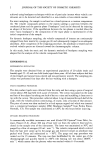
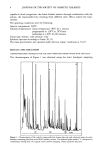
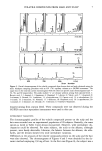
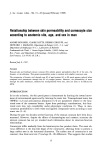
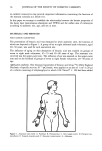
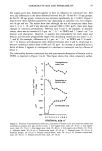
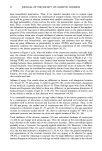
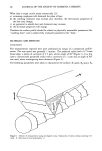
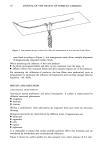
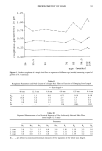
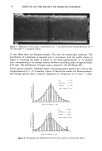
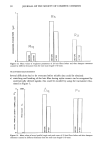
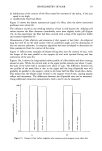
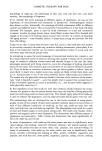
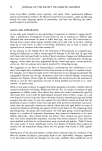
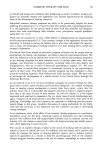
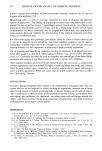
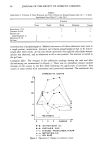
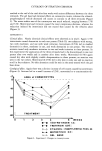
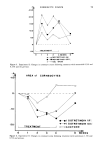
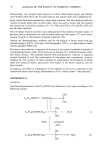
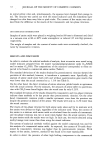
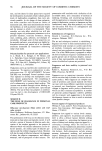
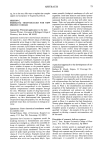
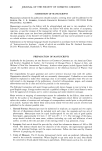
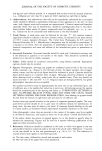
30 JOURNAL OF THE SOCIETY OF COSMETIC CHEMISTS Figure 3. Instrumental set-up to adjust hair fibers for measurement of cross sections of hair fibers. were fixed according to Figure 3 this arrangement easily allows straight alignment of longitudinally expanded swollen fibers. When measuring the influence of hair care products ß the fibers investigated before and after in vitro treatment were the same, or ß different fibers were evaluated before and after repeated regular use of the products. For measuring the influences of products, the hair fibers were randomized prior to measurement to randomize the influence of temperature and humidity changes (relative humidity --60-80%). RESULTS AND DISCUSSION LONGITUDINAL MEASUREMENTS Interrelation between profilometric and optical investigations. A surface is characterized by different structural phenomena: ß roughness ß waviness ß contour Within a profilometer these phenomena are separated from each other by electronic filtering. Biological specimens are characterized by different levels of organization too: ß molecules ß organelles ß cells ß organs ß organisms It is reasonable to expect that surface profiles somehow reflect this hierarchy and are modulated by biorhythms and environmental influences. Figure 4 shows the surface profile of a hair scanned over a short distance of 0.4 mm.

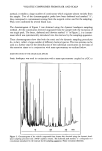
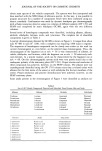
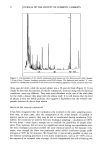
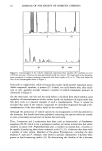
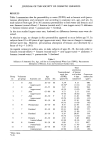
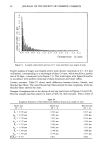
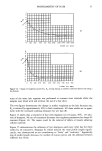
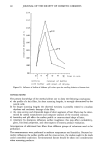
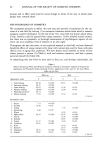
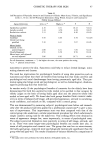
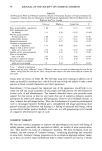
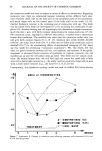
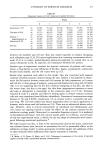
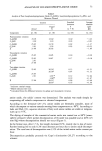
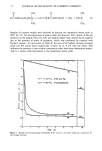
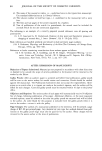
PROFILOMETRY OF HAIR 31 ¸ i o o direction of scan in mm Figure 4. Surface profile of a hair fiber (scan length 0.4 mm, axe-shaped stylus). The peaks seen originate from individual cuticular cells the mean distance between adjacent cells is 6-7 Ixm. This phenomenon is even more easily seen in Figure 5 where a different stylus is evalu- ated. A value of about 1 peak or cell/7 Ixm can be found (7). These results are compa- rable to electron microscopic findings revealing a mean distance between succeeding cuticular cells of 5-7 Ixm. Twenty hair fibers from one person were investigated, providing a mean value for Pc •1150 peaks/cm this value corresponds to a mean distance of 8.7 Ixm between suc- ceeding cells (Table I). Therefore, when using a scan length of 0.4 mm, the counted peaks result mainly from the thresholds or steps between adjacent cells. To determine if the roughness increases when moving from the root towards the tip region, we measured repeatedly a rather long (30 cm) and intact blonde hair with a scan length of 0.4 mm. An increase in roughness could be detected near the tip (Figure 6). This increase of Pc is a consequence of the difference in structure, possibly of the beginning of damage, which may be the reason for the better detectability of cell edges, i.e., increasing Pc at the tip region. In physical terms this means an increasingly loose attachment of cuticle cells to the cortex. The influence of scan length can be seen from Table II. Increasing scan length causes an increase in roughness parameters Rq, Rt, and Rz, but a decrease in Aq and Pc (Table II). The reason seems to be the increasing contributions from periodic or stochastic alter- ation of the hair surface which increase Rq, Rt, and R z. The decrease in Aq and Pc is caused by the loss of the fine structure determined by individual cells when increasingly longer segments of hair surface are scanned with constant data storage capacity.
Purchased for the exclusive use of nofirst nolast (unknown)
From: SCC Media Library & Resource Center (library.scconline.org)