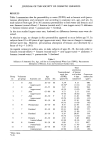
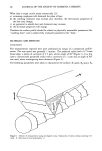
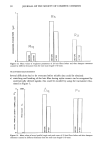
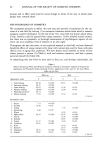
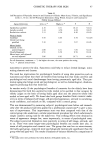
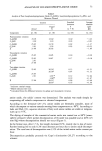
72 JOURNAL OF THE SOCIETY OF COSMETIC CHEMISTS its initial yellow color and, simultaneously, the aqueous layer changed from orange to red. The titration was carried out with the mixed indicator until the chloroform layer changed its color from navy blue to pink-violet. The content of free amine was calcu- lated from the difference in the results of the titanometric and two-phase titrations. DRY SUBSTANCE DETERMINATION Samples of amine oxide were placed in weighing bottles (60 mm in diameter) and dried in a vacuum oven at 80 or 40øC under atmospheric or reduced (25 mm Hg) pressure, respectively. The weight of samples and the content of amine oxide were occasionally checked, the latter by titanometric titration. RESULTS AND DISCUSSION In order to evaluate the selected methods of analysis, their accuracies were tested using model mixtures prepared from the master laurylamidopropylamine oxide (C•2NNO) and its amine (C•2NN). The compositions of the mixtures corresponded to those ex- pected to be found in commercial amine oxides (Table I). The standard deviations of the results obtained by potentiometric titration showed the precision of this method however, it introduces a systematic error. Specifically, the analysis of amine oxide alone both with and without quaternization gave results that were lower than the actual contents by ca. 1.3% (see Table I). On the other hand, the direct titrations of amine solutions yielded results in agreement with the actual contents. For the mixtures, the amounts of amine (after its quaterniza- tion with CH3I) were found higher than the actual ones by only 0.23%. The standard deviations of the results obtained by titanometric and two-phase titrations indicate these methods to be less precise than potentiometric titration. On the other hand, titanometric titration yields a smaller systematic error than the previous one despite the presence or absence of free amine. The results were only ca. 0.2% lower than the actual contents. The results of two-phase titration for both amine oxide alone and for its mixtures with free amine were always too high, regardless of the indicator used. Thus, the content of free amine in a mixture with amine oxide as calculated from the results of titanometric and two-phase titrations was two or more times higher than the actual contents. Even for pure amine oxide the results were too high. In each case, the results obtained using methyl orange were worse than those using the mixed indicator. The system of analytical methods verified against the model compounds was used for the analysis of a commercial amine oxide. As expected, the content of N-oxide deter- mined by titanometric titration was higher than by potentiometric titration. With respect to free amine, however, method II was found to be more reproducible. In order to detect the presence of other high boiling components in the commercial

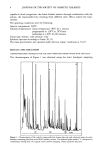
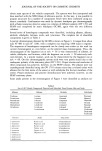
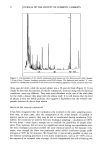
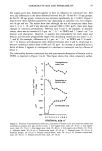
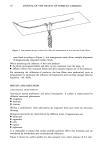
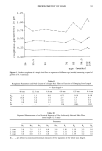
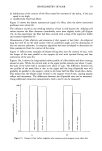
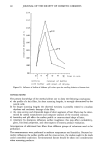
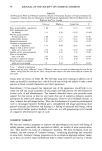
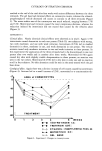
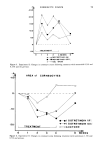
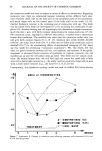
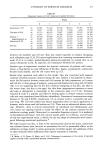
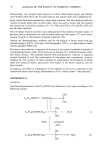
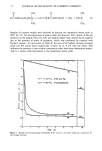
ANALYSIS OF COCAMIDOPROPYLAMINE OXIDE 73 Table I Analysis of Pure Laurylamidopropylamine Oxide (C•2NNO) , Laurylamidopropylamine (C•2NN), and Mixtures Thereof Content Standard Average deviation absolute Found S error Actual X (n = 8) AX Component wt. (%) wt. (%) wt. (%) wt. (%) Potentiometric titration C•2NNO 25.05 C22NN 2.02 %2NNO 25.05 C22NN 2.01 ]E 27.06 Titanometric titration %2NNO 25.05 C22NNO 25.05 C22NN 2.01 • 27.06 Two-phase titration %2NNO Ci2NNO C22NN 23.82 0.02 - 1.23 2.01 0.01 -0.01 23.78 0.02 - 1.27 2.24 0.03 +0.23 26.02 - 1.04 24.85 0.30 - 0.20 24.87 0.17 - 0.18 25.05 26.562 0.13 + 1.51 26.382 0.07 + 1.33 25.05 2.01 4.652* 0.12 +2.64 3.682* 0.19 + 1.67 27.06 29.522 0.09 +2.46 28.552 0.16 + 1.49 2 Indicator: methyl orange. 2 Mixed indicator (see text). * Calculated from the difference between two-phase and titanometric titration. amine oxide, the solids' content was determined. The analysis was made simply by evaporating off volatile components at elevated temperature. According to the literature (20-27), amine oxides are thermally unstable, most of which decompose to various extends starting from temperatures ca. 80øC. According to Lake and Hoh (13), aqueous solutions of fatty acid amine oxides are stable at tempera- tures up to 75øC. The drying of samples of the commercial amine oxide was carried out at 80øC (atmo- spheric pressure) where partial decomposition of N-oxide was possible and at 40øC (25 mm Hg) where decomposition should not occur (Figure 1). In the former case, after 1.5 h, the weight decreased 67%, mainly due to loss of water. Further heating led to only 0.2% mass decrease per hour due to amine oxide decompo- sition. The total rate of decomposition was 2.2% of the initial amine oxide content per hour. Decomposition probably proceeds via Cope's elimination (26,27) according to the scheme:
Purchased for the exclusive use of nofirst nolast (unknown)
From: SCC Media Library & Resource Center (library.scconline.org)