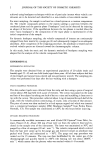
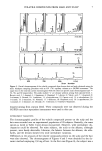
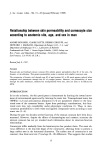
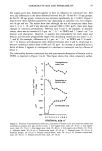
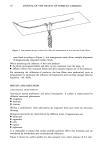
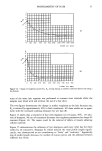
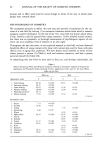
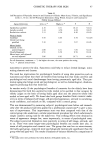
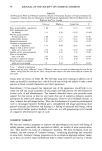
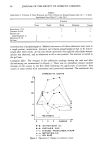
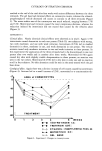
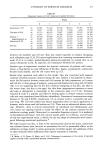
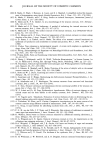
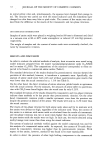
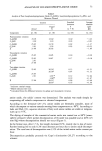
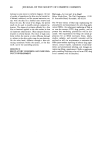
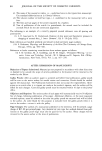
PROFILOMETRY OF HAIR 33 1.25 1.00 0.75 0.50 0.25 o. GO ..__/ /% age (weeks) Figure 6. Surface roughness of a single hair fiber at segments of different age (weeks) (assuming a speed of growth of 0.3 mm/day). Table II Roughness Parameters and Peak Counts of a Single Hair Fiber as Function of Changing Scan Length -- Scan-length-- 40 nm 12.5 nm 4.0 nm 4.0 nm 1.25 nm 0.4 nm Rq 3.5 1.5 0.8 0.71 0.36 0.18 R t 14.0 4.6 3.4 2.7 1.4 0.7 Rz 7.6 3.4 2.0 2.0 1.1 0.4 q 0.8 0.8 3.3 1.9 4.1 3.9 Pc - - - 520 1043 1225 Table III Repeated Measurement of an Identical Segment of One Arbitrarily Selected Hair Fiber (scan length 12.5 mm) Parameter Rt x Rt2 Rt3 Rt4 Rt5 Ra Rq Rp Aq 1. scan 5.6 7.1 3.5 4.8 5.6 1.10 1.39 3.2 1.0 2. scan 5.6 6.9 3.5 4.8 5.5 1.11 1.39 3.2 1.0 3. scan 5.6 6.8 3.5 4.8 5.6 1.11 1.39 3.2 1.0 Rt•... 5 are defined as maximum/minimum distances of five segments of the whole scan length.

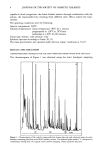
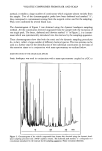
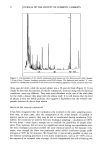
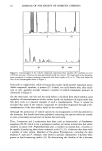
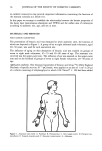
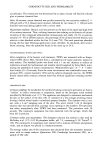
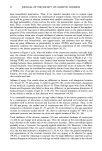
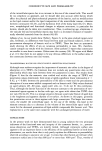
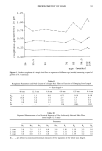
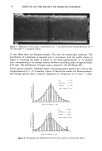
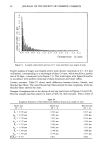
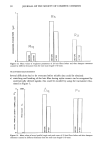
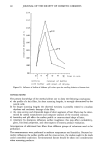
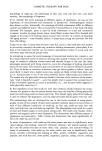
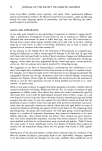
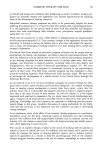
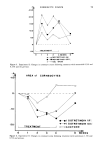
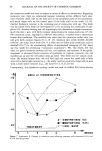
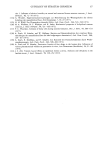
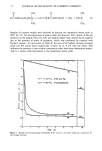
34 JOURNAL OF THE SOCIETY OF COSMETIC CHEMISTS -.--- ..... Figure 7. SEM photo of hair surface, scanned from root -- tip (whole section) and partially from tip -- root (left half) (-- & damaged surface). 14 hair fibers from one European female). The hair was cosmetically unaltered. The distribution of amplitudes is gaussian and in accordance with the profile shown in Figure 9. Counting the peaks in Figure 9, one finds approximately 11-12 peaks/4 mm, corresponding to an average distance between succeeding peaks of approximately 0.35 mm. The distribution of longer scans is skewed to the left (Figure 8b). Fourier analysis ofprojSles. Published results concerning growth speed of hair claim a rate of approximately 0.3--0.4 mm/day. Figure 10 depicts the results of a Fourier analysis. The average spectra show a distinct maximum at a frequency of 2.4 mm-•, corre- Rq = 3. 593 • • sk ....... 0.097 • •1• ....... 0.629 _o • scan-length 10 mm -I•.S '-8:S '-6:S '-4:S -2'.S' -C•.i ' I.S' 3.S 5.S ?.S 9.5 11.S profile-height in •m Rq = 4.191 • skewness = 1.267 • excess = 4.069 .......... ,,i : : : = ....... -10.5 -8.5 -6.5 -4.5 -2.5 -0.5 1.5 3.5 5.5 7.5 9.5 11.5 profile-height in •m Figure 8. Histograms and distribution function of Rq values of untreated hair fibers.
Purchased for the exclusive use of nofirst nolast (unknown)
From: SCC Media Library & Resource Center (library.scconline.org)