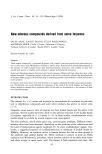
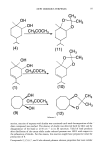
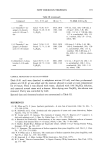
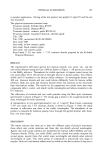
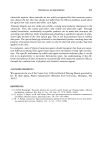
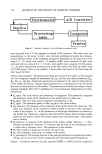
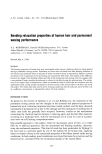
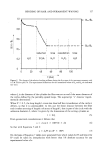
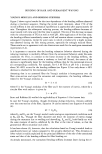
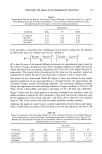
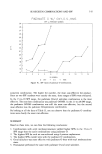
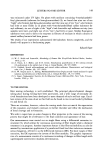
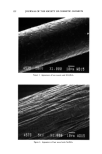
114 JOURNAL OF THE SOCIETY OF COSMETIC CHEMISTS [ Perthometer t Traversing table A/D Converter[ I Computer] I [Printer[ Figure 1. Schematic drawing of the profilometry equipment used. were digitized with a 12-bit analogue-to-digital (A/D) converter. The traces were run perpendicular to the major furrows, since previous profilometry studies have demon- strated different values of the roughness parameters depending on the directions of the scans (11-13). From each replica, 75 parallel profile traces (interval 40 !zm) were collected within an area of 6.0 X 3.0 mm. Each profile trace consisted of 1024 points, i.e., the three-dimensional reconstruction of the skin surface was built up from a total of 76,800 points. Prior to the analysis, a mean plane was fitted to the data using the least square method. Surface texture parameters. Parameters describing the texture of the surface can be grouped into two categories: amplitude parameters (R•, Rq, and Ry) and shape parameters (Rsk, RK, Rn, k•, and A•). Amplitude parameters are measures of the vertical characteristics of the surface deviations, whereas shape parameters are a combination of the horizontal and vertical characteristics of the surface. The parameters are defined according to Inter- national Standards ISO 4287/1 (published by the International Organization for Stan- dardization). ß Ra (!xm): The most widely used parameter for roughness. This parameter comprises the arithmetic mean of the departures of the profile from the mean line. ß Rq (•m): The root mean square parameter corresponding to R•. ß Ry (!xm): The maximum peak-to-valley height of the entire surface. ß Rsk (skewness): The measure of the symmetry of the profile about the mean line. The value is an indicator of the cumulative width of peaks in relation to the cumulative width of the furrows, i.e., of the asymmetry of the height distribution in relation to the middle line. Skewness is negative when the relief is mainly formed of broad peaks (plateaus) and positive when the furrows mainly have horizontal bases. This param- eter is unitless. ßRlc (kurtosis): A measure of the sharpness of the surface profile. Kurtosis = 3 for a Gaussian distribution. Kurtosis 3 indicates that the base of the distribution curve is wider than a Gaussian curve. This parameter is also unitless. ß Rn: The number of peaks per cm about the mean line. ß Aa: The arithmetic mean slope in radians of the profile. ß • (wavelength): The average measure of the spacings between local peaks and valleys, taking into account their relative amplitudes and individual spatial frequencies. Statistics. Correlation between the skin response (TEWL or CBFV) and the number of

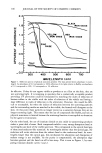
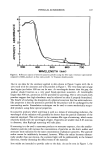
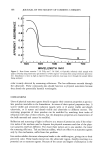
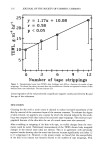
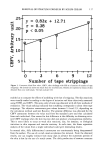
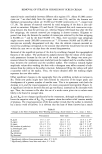
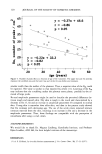
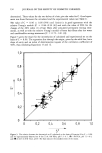
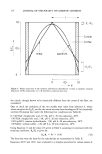
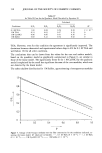
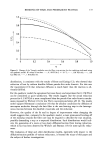
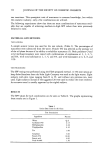
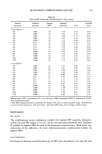
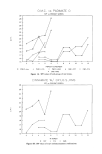
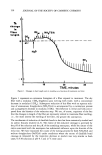
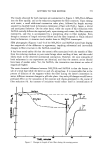
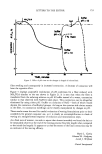
REMOVAL OF STRATUM CORNEUM BY SCRUB CREAM 115 tape strippings was calculated using the linear regression analysis, which also was used to calculate the correlation between Rn and the age of the individuals. The Friedman test was used to evaluate if there were significant differences between the visual ranking of the areas, i.e., to test the hypothesis that the treatments were equal. Differences in the roughness parameters between untreated and treated sites were tested for signifi- cance using Student's t-test for paired data. P 0.05 was considered significant. RESULTS Visual ranking of the SLS-challenged areas showed the area stripped 12 times to be the most irritated one in all of the volunteers, followed by the area stripped six times, (Table I). The area stripped three times and the scrubbed area were approximately equal in irritation. The untreated area was the least irritated one. Statistical analysis of the data showed that there are significant differences between the treatments. This same order of rank was obtained also when the objective assessments were made. In Figures 2 and 3 the effect of stripping on the TEWL and CBFV, respectively, is shown. Linear regression analysis of the values shows significant positive correlation between TEWL and the number of strippings, as well as between CBFV and the number of strippings. The TEWL and the CBFV values for the scrubbed areas were 12.9 --- 5.1 and 15.1 --- 9.0, respectively. For TEWL this corresponds to 2.4 and for CBFV to 2.9 tape strip- pings (Figures 2 and 3). Another way of estimating the scrub effect is to analyze the values from each volunteer by linear regression, and then from each graph to relate the effect of scrubbing to that of the tape strippings. This way of calculation gave 2.9 --- 2.4 tape strippings for the TEWL and 1.4 _+ 2.2 for the CBFV. Figure 4 shows three-dimensional reconstructions of the skin surface of one individual before and after the treatments. The visual appearance of the surface shows that no changes in the major structure were induced by the treatments. However, in the scrubbed area a more pronounced microprofile can be seen. The mean values for the parameters used to characterize the topography of the surface are summarized in Table II. The amplitude parameters Ra, Rq, and Ry tended to increase by washing (no signifi- cant difference), while they were significantly lower after the use of the scrub cream. Among the shape parameters, only RK, Rn, and Ka were changed significantly by the treatments. R K and Rn increased, whereas Ka decreased. The relationship between Rn and the age of the volunteers, for untreated and scrubbed skin, is presented in Figure 5. Table I Subjective Rank Order Data for Various Treatments on Obtained Irritation in Nine Volunteers Sum of Mean Treatment visual ranks • visual rank S.D. Untreated 36.5 4.1 1.0 Scrubbed 33.0 3.7 0.8 3 strippings 32.5 3.6 1.0 6 strippings 22.5 2.5 1.3 12 strippings 10.5 1.2 0.2 The treatments were different, P 0.05. • Rank 1 = most irritated skin area 5 = least irritated.
Purchased for the exclusive use of nofirst nolast (unknown)
From: SCC Media Library & Resource Center (library.scconline.org)