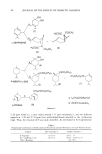
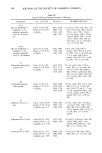
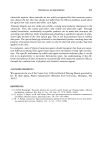
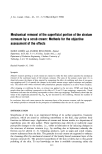
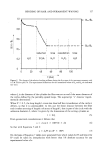
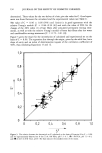
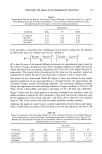
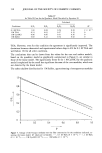
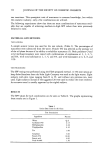
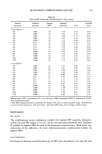
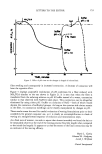
BENDING OF HAIR AND PERMANENT WAVING 135 Table II Experimental Data for the Relative Values of the Young's Modulus in the Reduced State, Ere, and for Fiber Bending Recovery R e Taken from Reference 4, and the Relative Bending Stiffnesses, B•/B o, Calculated from R e with Equation 32 for Four Reducing Conditions Experimental Conditions E•/E o R e B•/B o 0.3 M TGA 0.58 0.37 0.36 1 M TGA 0.27 0.20 0.19 1 M Cys-HCl 0.51 0.37 0.36 1 M Sulfite 0.52 0.44 0.42 Ec/Eo and Es/E o to determine that combination of the relative moduli (for 1% absolute accuracy) that gives the smallest value for A2, defined as A 2 [Bre(exp)- Bre(calc)] 2 -Ere(exp) - Ere(calc)] 2 = ß + (33) Bo Bo A 2 is thus the sum of the squared differences between the experimental (exp) values for the relative Young's modulus and the relative bending stiffness (see Table II) and the values calculated (calc) according to Equations 26/27 and 30/31 (see Tables III and IV), respectively. The results of the calculations for the linear and the quadratic model are summarized in Tables III and IV and illustrated in Figures 5 and 6, respectively. The results for the linear model (Table III, Figure 5) show that already for this simple approach satisfactory if not good agreement is obtained between the experimental and calculated Young's moduli and bending stiffnesses. The maximum difference between theory and experiment for either bending stiffness or Young's modulus is 7% for 0.3 M TGA, 2% for 1 M Cys-HC1, and drops to and below 1% for 1 M TGA and 1 M Sulfite. Figure 5 shows that the model predicts a virtually unchanged core modulus, while the surface modulus is reduced by 50% compared to the initial value for all conditions, save for the application of the strong reductant ! M TGA, pH 9. Here the core modulus drops to 70% of the initial value and the surface modulus virtually vanishes. Applying the quadratic model leads to complete agreement between theory and experi- ment, as reflected by the values of A 2 that drop to zero for all conditions, save for 0.3 M Table III Values for the Relative Core and Surface Moduli, E c and E s, Obtained With the Linear Model (Equation 24) by Optimization to Reach the Closest, Simultaneous Agreement as Reflected in the Values of A 2, Between the Experimental (see Table II) and Calculated Values for the Relative Young's Modulus and Bending Stiffness in the Reduced State Calculated Conditions E•/E o E•/E o E•/Eo B•/Bo A2 0.3 M TGA 1.00 0.27 0.51 0.42 8 x 10 -3 ! M TGA 0.70 0.06 0.27 0.!9 2 x !0 -5 ! M Cys-HC1 1.00 0.23 0.49 0.38 10 -3 ! M Sulfite 0.99 0.28 0.52 0.42 2 X !0 -5

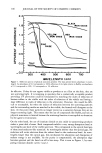
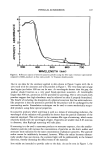
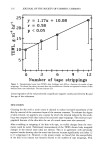
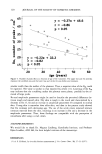
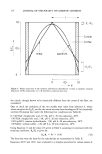
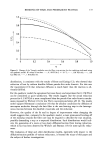
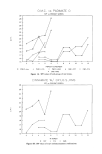
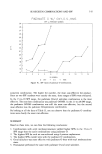
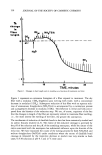
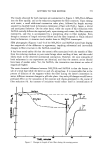
136 JOURNAL OF THE SOCIETY OF COSMETIC CHEMISTS Table IV As Table lll, but for the Quadratic Model Described by Equation 28 Calculated Conditions Ec/Eo Es/Eo E•/Eo B•/Bo A2 0.3 M TGA 1.00 0.08 0.54 0.39 2 X 10 -3 I M TGA 0.51 0.03 0.27 0.19 0 1 M Cys-HCl 0.96 0.06 0.51 0.36 0 I M Sulfite 0.82 0.22 0.52 0.42 0 TGA. However, even for this condition the agreement is significantly improved. The deviations between theoretical and experimental values drop to 4% for 0.3 M TGA and well below 1% for all other conditions. The conclusions that can be drawn from the values for the core and surface moduli, based on the quadratic model as graphically summarized in Figure 6, are similar to those of the linear model. The significantly better fit for 1 M Cys-HC1 by the quadratic model is explained by the small but significant decrease of the core modulus, which was not detected by the linear model. The rather shallow distribution for ! M Sulfite, approximating a homogeneous modulus o o,,, -I '"-.-.. ' 02 -- ,,,,,, 0 ......... 0 0,2 0,4. 0,6 0,8 1,0 Figure 5. Change of the Young's modulus over the fiber cross-section for the conditions indicated, as- suming the linear model. A 2 values are in brackets. '' ', 0.3 M TGA (8 X 10⁻³) -'-, 1 M TGA (2 X 10⁻⁵) ---, 1 M Cys-HCI (10-3) --, I M Sulfite (2 X 10⁻⁵).
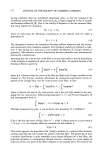
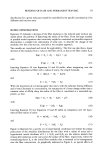
Purchased for the exclusive use of nofirst nolast (unknown)
From: SCC Media Library & Resource Center (library.scconline.org)