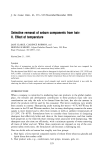
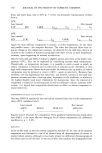
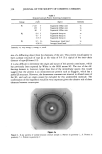
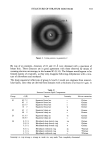
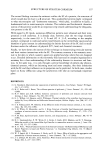
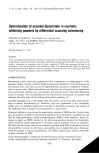
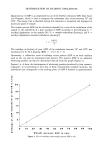
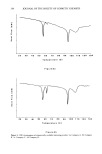
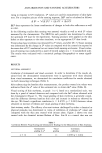
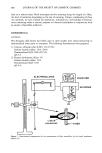
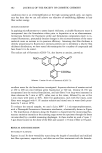
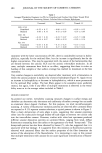
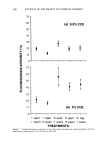
362 JOURNAL OF THE SOCIETY OF COSMETIC CHEMISTS logue reported as successfully analyzed is the 2,6-dilauryl ester. We find that the method produces inconsistent results when applied to the dipalmitate, most likely due to thermal degradation. A thin-layer chromatographic (TLC) method for the determina- tion of ascorbic acid esters has been described (9). Cosmetic whitening powders are generally composed of inorganic materials such as talc, titanium doixide, sericite, and mica, and an organic active ingredient. Since the ex- cipient materials generally will not have thermal transitions between 20 ø and 150øC, it was reasoned that perhaps ADP is amenable to quantitation by DSC in this inorganic matrix. REAGENTS AND APPARATUS Ascorbyl dipalmitate was obtained from Nikko Chemicals, Ltd., Tokyo, Japan. Ascorbyl palmitate (NF-FCC grade) and ascorbic acid (USP grade) were obtained from Hoffman-La Roche, Inc. (Nutley, NJ). Dehydroascorbic acid was purchased from Pfaltz & Bauer, Inc. (Waterbury, CT). These compounds were used without further purifica- tion. A DuPont Instruments Model 1090 Thermal Analyzer, Model 910 Differential Scan- ning Calorimeter Base, and a Model 1091 Disc Memory were used throughout this study. Standard aluminum DSC pans (DuPont Part No. 900786-901 and 900779-901) were used. The samples (approximately 10 mg, weighed accurately to + 0.01 mg) were weighed directly into the tared pans. The samples were then heated at a programmed rate of 5ø/min. The Advanced DSC Data Analysis Program (DuPont Part No. 994485- 901) was used for the integration of the areas 'of the endotherms. A Spectra Physics Model SP-8000B HPLC was used for the chromatographic analyses, using Chromegabond Diamine (5 }xm) and a UV detector at 255 nm (6). RESULTS AND DISCUSSION As an initial approach to this problem, the thermograms of ascorbic acid, ascorbyl palmirate, and dehydroascorbic acid were obtained and compared to that of ADP. De- hydroascorbic acid is the reaction product that results when ascorbic acid undergoes oxidation. The free acid and the monoester are the products expected from hydrolysis of the diester. As can be seen in Figure la, the thermogram of ADP consists of three major en- dotherms. The highest endotherm corresponds to the melting of ADP (8). This melting-point endotherm is of no value for quantitative purposes, because it occurs within one degree of the melting-point endotherm of ascorbyl monopalmitate (Figure lb). Dehydroascorbic acid and ascorbic acid exhibit no thermal transitions between 30 ø and 130øC (Figures lc and ld). The endotherm of ADP that occurs between 56 ø and 58øC is suitable for quantitation because it does not coincide with any thermal transitions from any of the expected degradation products. This permits determinations on a particular sample, since the manufacture of the products is dry blending at ambient temperature.

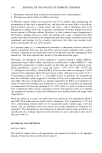
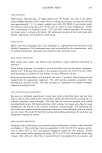
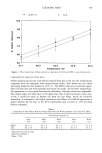
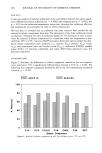
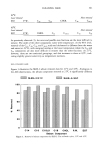
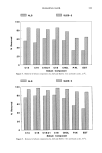
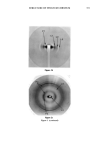
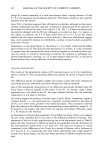
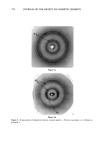
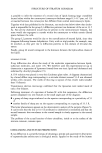
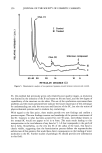
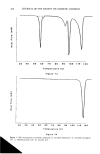
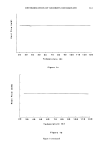
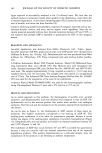
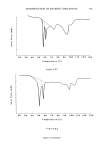
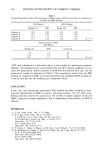
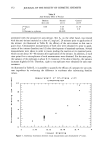
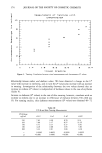
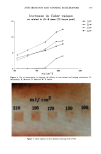
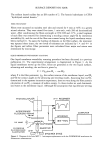
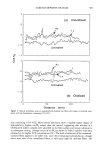
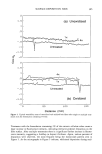
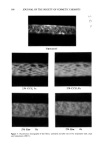
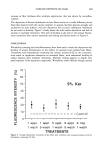
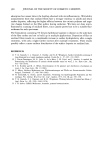
DETERMINATION OF ASCORBYL DIPALMITATE 363 Quantitation of ADP is accomplished by use of the DuPont Advanced DSC Data Anal- ysis Program, which is used to integrate the endotherm that occurs between 56 ø and 58øC. The energy that is absorbed during this transition is integrated and displayed in Joules per gram of sample. The weight percent ADP can be calculated manually by a ratio of the endotherm of the sample to the endotherm of a pure standard of ADP according to the following [c = ascorbyl dipalmitate in the sample (%) U = sample endotherm (Joules/g) and S = ascorbyl dipalmitate standard endotherm (Joules/g)]: 100 U C -- The enthalpy in Joules/g of pure ADP of the endotherm between 56 ø and 58øC was determined to be 30.4 Joules/g (RSD = ---0.7 N = 3). Alternately, a calibration curve of enthalpy versus percent ADP in an inert medium such as talc can also be determined and plotted. The percent ADP in an unknown whitening powder can then be determined directly from the graph (Figure 2). Figures 3 a-d show the thermograms of whitening powders produced by four cosmetic companies. It is interesting to note that in these commercially available mixtures, the endotherm that corresponds to the melting point of ADP is lowered to approximately E 3O 25 2O 15 10 ! ! i i ! , ! t 10 20 30 40 50 60 70 80 90 100 Weight percent ADP in talc Figure 2. Plot of enthalpy versus weight percent ADP in talc.
Purchased for the exclusive use of nofirst nolast (unknown)
From: SCC Media Library & Resource Center (library.scconline.org)