CHANGES IN STRATUM CORNEUM 109 each. The computer program calculated the average intensity and the standard deviation of the intensity for the pixels of this area of interest. A threshold of gray level was selected from the screen image to define shadow areas. The program then yielded variables such as total and mean shadow areas and their distribution, total and mean shadow perimeters and their distribution, and the ratio of areas and perimeters. These variables were used to quantitate the changes in skin surface properties. The mean depth of the dermatoglyphics was calculated from the ratio of the shadow areas to the shadow perimeters as described by Barton and Black (25). CLINICAL GRADINGS The patched sites were graded according to the scale of Frosch and Kligman (11): (i) Erythema: slight redness, spotty or diffuse (1 q-) moderate redness (2 q- ) intense redness (3 q- ) fiery red with edema (4 q- ) (ii) Scaling: fine (1 q- ) moderate (2 q-) severe with large flakes (3 q-) (iii) Fissures: fine cracks (1 q- ) single or multiple broader fissures (2 q- ) wide cracks with hemorrhage or exudation (3 q- ) MACROPHOTOGRAPHIC DOCUMENTATION Macrophotography was performed with a Medical Nikkor © lens with an integral ring flash and a Nikon FE-2 body using Kodak Ektachrome © 100 slide film. All photographs were taken at a 1:2 magnification. Photographs were taken for documentation but were not used for assessment or grading purposes in this study. However, such photographs can be of value as part of the total methodology for assessing stratum corneum changes. STATISTICAL ANALYSIS All statistical analyses were performed by using the SAS © statistical software package in a 386-based computer (26). In each test cycle, the one-way ANOVA procedure was used for each subgroup to compare the data from each instrumental test parameter for day-to-day variability during the test cycle. To compare the means of the total visual scores, the Wilcoxon signed rank sum test for paired data was applied for each surfactant. The correlations between two test parameters were determined by using the least square methods. The correlations between test parameter and visual scores were calculated by using the Spearman (non-parametric) tests. For each test parameter, mean values between different surfactant treatments and be- tween the same surfactant treatment for two test cycles were compared using the one-way ANOVA procedure. Significant difference was at the level of p = 0.05. RESULTS The instrumental data for TEWL, electrical conductance, moisture factor, and reflective color indexes are presented in both tables and figures in this part.

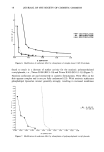
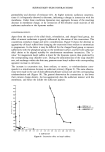
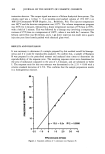
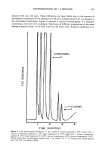
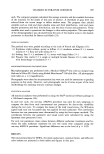
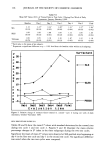
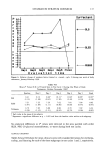
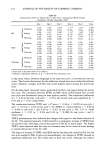
110 JOURNAL OF THE SOCIETY OF COSMETIC CHEMISTS The tables present day-by-day mean values with standard deviations (S.D.) for each instrumental parameter. The figures present the data as the mean relative percentage changes. Both treated and control site values obtained at any day during the test period plus the corresponding initial baseline values were taken into consideration to arrive at a single number of the relative percentage change for each subject, as follows: (% P)n = [(Pt/Pc)n - (Pt/P½)o]*100 where p z Pt --- (% P)n = (Pt/Pc)n = (Pt/Pc)o = any instrumental parameter (i.e., TEWL, electrical conductance, MF, a* and L*) the value from treated site the value from control site the day during a test cycle, n = 1-5, and 8 (final day for evaluation) the relative percentage change of P at day n the ratio of the values between treated and control sites at day n and the ratio of the baseline values between treated and control sites. Statistical significance is indicated in each table by superscript numbers, with 1 being significant at p = 0.05 level from the initial pretest baseline value, and 2 indicating significance at p = 0.05 level from the previous day's value. TRANSEPIDERMAL WATER LOSS (TEWL) MEASUREMENTS Tables I and II show the mean TEWL values for three subgroups in test cycles 1 and 2. The unit of TEWL values in g/m2/hr. Figures 1 and 2 show the relative changes observed during these two test periods. In test cycle 1, both SLS and SLES caused significant increases in TEWL values starting at day 1 after two 45-minute surfactant exposures. TEWL values at patched sites treated with these two surfactants showed steady increases during subsequent treatment days, although the degree of increase caused by SLES was far less than that caused by SLS. By days 4 and 5, after eight and ten 45-minute SLS patches, respectively, the sites patched with SLS showed dramatic increases in TEWL. A significant increase in TEWL occurred Table I Mean TEWL Values (S.D.) of Treated Sites in Test Cycle 1 During One Week of Daily Treatments, October-November 1989' Baseline Day 1 Day 2 Day 3 Day 4 Day 5 Final 3.0 5.2 • 5.5 • 7.6 • 17.0 •'2 32.5 •'2 10.3 •'2 SLS (0.4) (0.1) (0.5) (1.1) (5.4) (9.8) (1.8) 4.1 6.1 • 6.0 • 7.1 • 8.0 • 12.0 •'2 7.0 •'2 SLES (0.6) (0.9) (1.0) (1.2) (1.4) (1.9) (2.3) 4.5 5.2 4.6 4.7 4.6 5.0 4.4 Tallowate (0.8) (0.7) (0.4) (0.7) (0.9) (0.6) (0.5) * Each value is the mean of six subjects unit of measurement is g/m2/hr. • Represents a significant difference at p = 0.05 level from the baseline value within each subgroup. 2 Represents a significant difference at p = 0.05 level from the previous day within each subgroup.
Purchased for the exclusive use of nofirst nolast (unknown)
From: SCC Media Library & Resource Center (library.scconline.org)