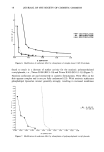
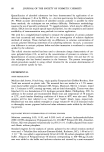
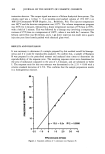
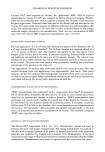
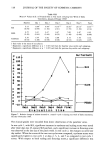
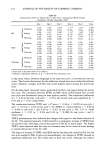
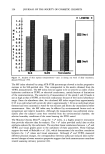
CHANGES IN STRATUM CORNEUM 111 Table II Mean TEWL Values (S.D.) of Treated Sites in Test Cycle 2 During One Week of Daily Treatments, January-February 1990' Baseline Day 1 Day 2 Day 3 Day 4 Day 5 Final 3.6 7.3 • 12.8 L2 37.7 •'2 51.7 ]'2 49.7 • 11.9 •'2 SIS (0.4) (0.6) (2.7) (10.4) (7.7) (5.7) (2.9) 4.5 5.1 6.7 • 9.7 • 10.9 ] 12.2 • 8.2 • SLES (0.9) (1.1) (1.1) (1.4) (1.0) (1.6) (1.4) 4.1 4.5 4.8 5.3 5.2 5.3 4.2 Tallowate (0.3) (0.8) (0.9) (0.6) (L0) (1.3) (0.9) * Each value is the mean of six subjects unit of measurement is g/m2/hr. • Represents a significant difference at p = 0.05 level from the baseline value within each subgroup. 2 Represents a significant difference at p = 0.05 level from the previous day within each subgroup. P 500-- Supfactant e p 450-- c 400-- e c SLS n 350-. t 3oo-- g ::,50-- e 200-- : SLES c •50-- h •,00-- õ0-- • ._..x,.---.--,x------• n e'•._.....,x___x....• g o • • • •-+"•• • PEG20 E! -50- Day • Day 2 Day3 Day4 Day5 Ftna:l Evaluation time Figure 1. Relative change of TEWL (treated vs. control---cycle 1) during one week of daily treatments, October-November 1989. between day 4 and day 5 with SLES, but was less than the mean SLS value on day 4. Mean TEWL values of the patched sites treated with SLS and SLES significantly de- creased at the final measurement taken after two days of rest. The patched sites treated with PEG-20 glyceryl monotallowate showed no significant changes in the mean values. No significant changes in TEWL were found on the control water-treated sites of all three subgroups during the entire test cycle. Figure 1, which shows the relative percentage changes in TEWL, clearly shows the

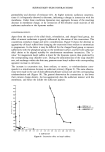
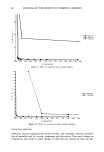
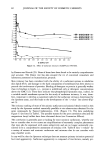
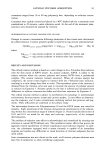
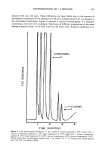
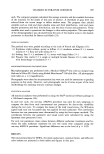
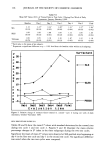
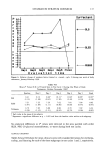
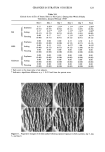
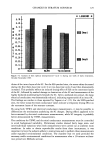
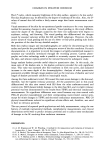
112 JOURNAL OF THE SOCIETY OF COSMETIC CHEMISTS p 700.- Sup f acf. anf. e 650- P 600 c 550 o SLS e 500 n 450 t: 400 g 350 e 300 250 • SLES c 200 h t50 8 t00 n 50 g 0 .• PE6g. O Day ! Day 2 Day3 Day4 Day5 Ftnal Eva].ua•:ton •:tme Figure 2. Relative change of TEWL (treated vs. control-•cycle 2) during one week of daily treatments, January-February 1990. marked effect of SLS. The slight relative increase and decrease observed with SLES and PEG-20 glyceryl monotallowate, respectively, are also shown. In test cycle 2, performed during January and February, significant increases in TEWL values were observed in patched sites treated with SLS starting at day 1, after the second surfactant application, and with SLES at day 2, after four 45-minute patches. On a day-by-day comparison, the mean TEWL values for SLS-treated sites were consistently higher than those recorded in test cycle 1 and were significantly greater on days 3, 4, and 5. No significant TEWL changes were found in sites treated with PEG-20 glyceryl monotallowate throughout the whole test cycle. Also, no statistically significant dif- ferences were observed between the two test cycles in subjects treated with these two surfactants. No significant mean changes in TEWL values were recorded for any of the control water-treated sites. ELECTRICAL CONDUCTANCE MEASUREMENTS Tables III and IV show the mean electrical conductance values and standard deviations of treated sites for test cycles 1 and 2. The unit for electrical conductance is (microSiemans). Figures 3 and 4 illustrate the mean relative percentage changes in electrical conductance for the two test cycles. In test cycle 1, a significant decrease from the initial baseline values was recorded after
Purchased for the exclusive use of nofirst nolast (unknown)
From: SCC Media Library & Resource Center (library.scconline.org)