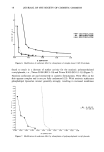
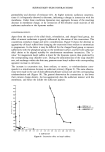
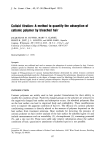
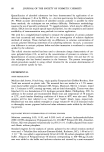
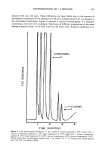
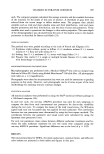
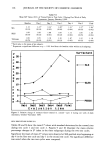
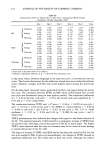
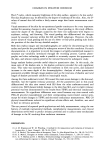
CHANGES IN STRATUM CORNEUM 123 Clinical Scores (S.D.) Table XII of Treated Sites in Test Cycle 2 During One Week of Daily Treatments, January-February 19901 Day 1 Day 2 Day 3 Day 4 Day 5 Final Erythema 0.17 0.83* 2.33* 3.17' 2.67* 2.0 (0.41) (0.45) (0.82) (0.41) (1.03) (0.89) SLS Scaling 0.17 0.67* 1.33* 2.33* 2.67* 3.00' (0.41) (0.52) (0.52) (0.82) (1.03) (0.00) Fissuring 0.00 0.17 0.17 1.33* 1.83' 0.67* (0.00) (0.41) (0.41) (0.52) (0.41) (0.52) 0.00 0.00 0.00 0.33 0.50 0.17 Erythema (0.00) (0.00) (0.00) (0.52) (0.55)0.83*0.00(0.45)(0.00)1.000.00 (0.4 SLES Scaling 0.00 0.33 0.33 0.67* (0.00) (0.52) (0.52) (0.52) (1.09) Fissuring 0.00 0.00 0.00 0.00 (0.00) (0.00) (0.00) (0.00) (0.00) 0.00 0.00 0.00 0.00 0.00 0.00 Erythema (0.00) (0.00) (0.00) (0.00) (0.00)0.000.00(0.00)(0.00)0.000.00(0.00) (0.0 Tallowate Scaling 0.00 0.00 0.00 0.00 (0.00) (0.00) (0.00) (0.00) (0.00) Fissuring 0.00 0.00 0.00 0.00 (0.00) (0.00) (0.00) (0.00) i Each score is the mean value of six subjects. * Indicates a significant difference at p = 0.05 level from the pretest score. Figure 11. Progressive changes of the skin surface following repeated exposure to S• at prctcst, day 3, day 5, and day 8.

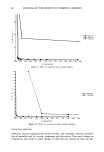
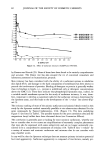
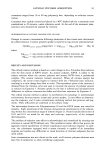
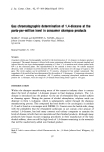
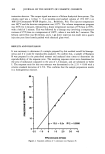
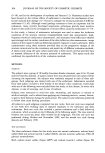
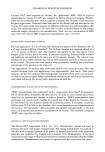
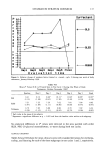
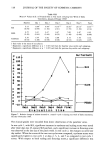
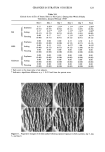
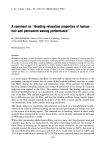
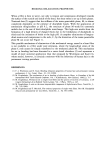
124 JOURNAL OF THE SOCIETY OF COSMETIC CHEMISTS Figure 12. Four images of skin replicas taken and day 8. ?om the same SLES treatment site at pretest, day 3, day 5, Figure 13. Four images of skin replicas taken from the same PEG-20 glyceryl monotallowate treatment site at pretest, day 3, day 5, and day 8. percentage change in TEWL caused by PEG-20 glyceryl monotallowate was 10% to 30% below zero, the possible moisturizing effect of PEG-20 glyceryl monotallowate was not statistically significant (27). High-frequency electrical conductance measurements best indicated the hydration con-
Purchased for the exclusive use of nofirst nolast (unknown)
From: SCC Media Library & Resource Center (library.scconline.org)