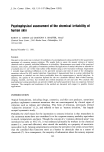
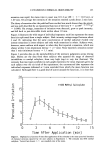
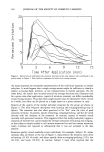
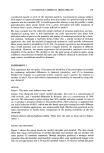
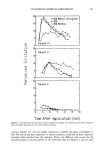
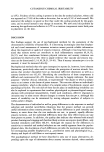
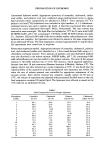
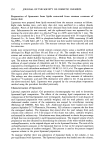
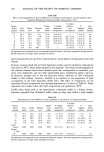
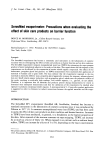
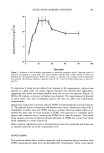
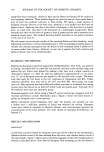
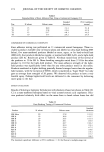
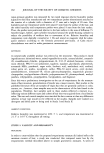
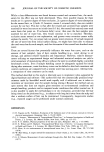
CUTANEOUS CHEMICAL IRRITABILITY 137 (1) L (1) n 15 IO 0 E i ! ! 15 10 Subject 13 0 i . ii , 15 10 Subject 16 ß .,/ 3 6 9 12 15 Time After Application (min) Figure 3. Presented in this figure are the individual data for three subjects who represented the range of irritabilities (high, medium, and low) obtained in the experiment. The data connected by points are the means over six sessions the scattered dots indicate the raw responses that comprise the means. Note that due to variable times of sensation onset, the raw data points vary along both axes.

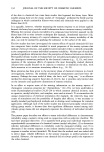
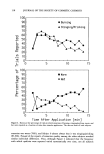
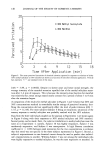
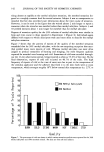
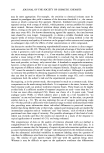
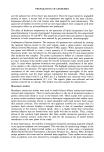
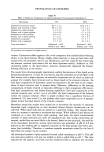
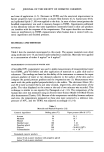
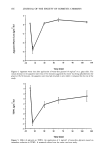
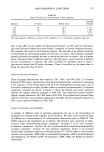
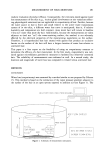
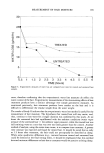
138 JOURNAL OF THE SOCIETY OF COSMETIC CHEMISTS lOO 90 80 70 ß -o 6o m 50 r._ 40 o • 30 r-• 20" m 10 , I m 0 -•--I r._ 0 I ,.i-. 1 oo © Burning ß Stinging/Pricking 5 10 15 90 80 7O 60 50 40 30 20 10 0 0 ß Warm m Hot 5 10 15 Time After Application [min] Figure 4. Shown are the percentage of trials on which sensations of burning, stinging/pricking, warm, and hot were reported as a function of time after stimulus application. The data are from all nine subjects. sensation was warm (78%), and Subject 6 almost always that it was stinging/pricking (93.8%). Perusal of the reports of sensation quality among the other subjects revealed similar individual differences. Thus, although Figure 4 indicated that the frequency with which qualities were reported varied systematically over time, not all subjects
Purchased for the exclusive use of nofirst nolast (unknown)
From: SCC Media Library & Resource Center (library.scconline.org)