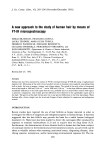
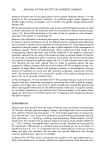
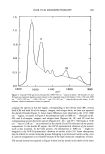
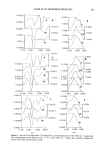
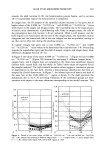
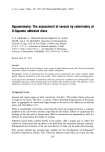
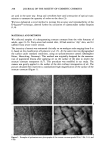
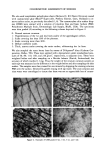
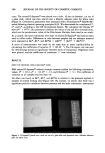
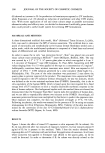
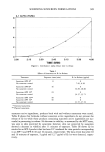
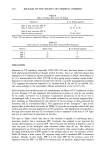
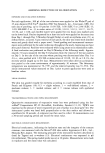
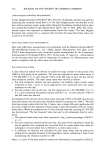
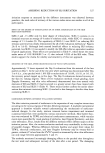
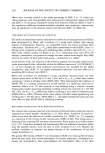
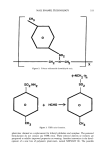
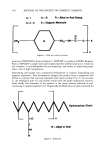
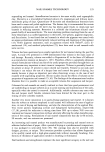
300 JOURNAL OF THE SOCIETY OF COSMETIC CHEMISTS cytes. The stained D-Squame © were placed over a hole, 16 mm in diameter, cut out of a glass slide, which was then placed onto a Minolta reference plate for 0ehite color (Figure 3). Colorimetric parameters were measured with a Chromameter © CR200 (Mi- nolta) following classical operating principles (8,9). We determined the coordinates L*, a*, and b*, according to the CIE International System. We calculated the Chroma C* after (a '2 q- b'2)•/2 this parameter combines the values of red and blue chromaticities, which are the predominant colors of the Polychrome Multiple Stain used in our study. As a control, the same evaluations were done on stained D-Squame © that had not been used to collect scales. Differences in color between samples and our reference material were expressed as AL*, AC*, and AE*ab = [(/•L*) 2 + (/•a*) 2 + (/•b*)2] •/2. A series of measurements was made on the same skin to assess reproducibility by calculating the coefficients of variation (V = SD.M-•). The Chi-square test was used for determining statistical significance between series of evaluations. Regression lines were plotted, and the coefficients of correlation "r" were calculated. RESULTS EFFECT OF PRESSURE UPON D-SQUAME © TAPES PMS stained D-Squame © without stratum corneum yielded the following colorimetric values: L* = 92.2, a* = 1.8, b* = 2.5, and Chroma C* = 3.1. The coefficient of variation on 25 samples was less than 1%. No effect was found on AL*, AC*, and AE*ab in relation to the pressures applied to samples of normal looking skin (Figure 4A). By contrast, on xerotic skin there was a significant positive correlation between pressure and the same colorimetric assessments Figure 3. D-Squame © placed over a hole cut out of a glass slide and deposited onto a Minolta reference plate for white color.

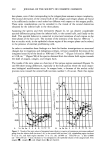
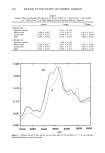
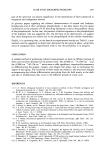
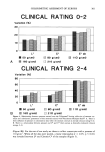
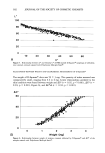
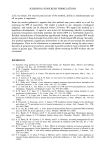
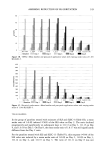
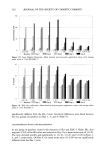
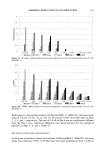
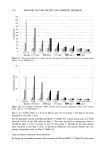
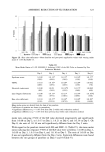
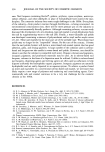
COLORIMETRIC ASSESSMENT OF XEROSIS 301 CLINICAL RATING 0-2 Variation (%) 30 A 20 10 0 L* C* I•1 50 g/cm2 • 80 g/cm2 I• I• 160 g/cm2 • 210 g/cm2 E* ab 110 g/cm2 CLINICAL RATING 2-4 Variation (%) 80 6O 4O 2O L* C* E* ab I•1 50 g/cm2 • 80 g/cm2 I•1 110 g/cm2 B 160 g/cm2 :• 210 g/cm2 Figure 4. Relationship between pressure exerted onto the D-Squame © during collection of stratum cor- neum and colorimetric parameters of this material stained with Polychrome Multiple Stain ©. A. There is little influence of pressure on colorimetric data when the stratum corneum is normal (clinical rating 0-2). B. There is a relationship between pressure and L* and C* when xerosis is clinically evidenced (clinical ratings 2-4). (Figure 4B). For the rest of our study we chose to collect corneocytes with a pressure of 110 g/cm 2. When all the data were pooled, a linear relationship (r = 0.95, p 0.01) was revealed between L* and Chroma C* of the samples (Figure 5).
Purchased for the exclusive use of nofirst nolast (unknown)
From: SCC Media Library & Resource Center (library.scconline.org)