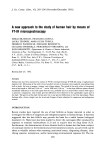
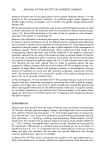
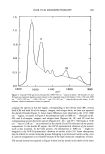
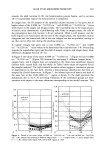
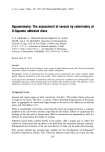
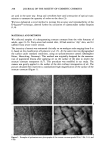
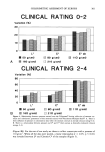
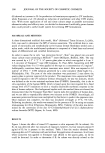
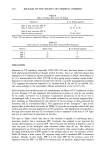
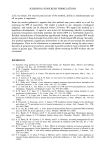
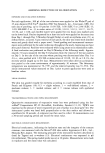
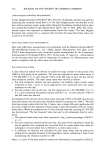
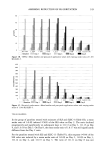
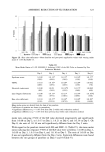
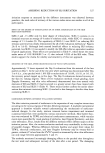
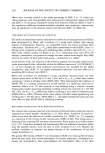
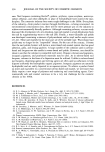
ASSESSING REDUCTION OF SLS IRRITATION 321 25 to 2 0.5 o ! SLS 1.0% 1'0.08 1'0.10 1'0.13 1:0.17 1'025 1'050 1'1.00 SLEC-13 2.8% • Baseline • Day 1 [• Day 2 [• Day 3 • Day 4 • Day 5 Figure 2A. Erythema--Mean baseline and post-patch application scores with varying molar ratios of 1.0% SLS:SLEC- 13. SLS 1.0% Baseline • Day 1 ß 008 1:010 1.0.13 1:0.17 1'0.25 1'0.50 1'1.00 SLEC-132.8% ,•-• Day 2 •[• Day 3 • Day 4 • Day 5 Figure 2B. TEWL--Mean baseline and post-patch application values with varying molar ratios of 1.0% SLS:SLEC- 13. With respect to the panelists treated with SLS and SLEC-13 (Table IV), the mean molar ratios of 1:0.10, 1:0.10, 1:0.12, and 1:0.18 induced •50% of the SLS value on Days 2, 3, 4, and 5, respectively. The ratio of 1:0.09 on Day 8 was not significantly different from the Day 2 ratio. Statistical differences were found between the two groups of panelists on Days 3, 4, and 5 (Table V). ELECTRICAL CONDUCTANCE MEASUREMENTS In the group of panelists treated with mixtures of SLS and SLEC-5 (Table III), the mean molar ratio inducing •50% of the SLS value decreased progressively from 1:0.08 on

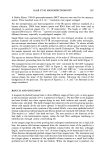
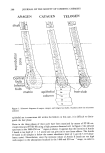
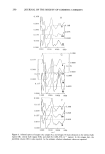
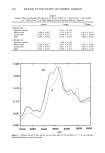
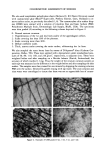
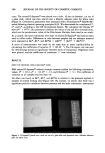
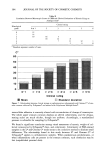
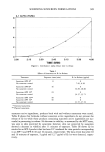
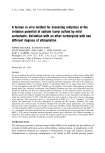
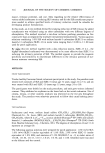
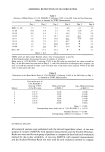
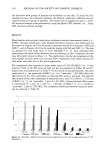
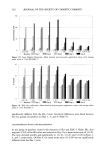
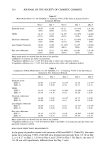
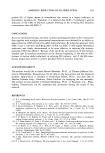
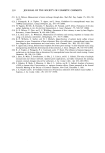
322 JOURNAL OF THE SOCIETY OF COSMETIC CHEMISTS 11oo 1 ooo -- 9OO 800 (• 700 r- E 600 2 5oo .o_ E 4OO 3OO 200 lOO o SLS10% 1 008 1'010 1'0.13 1'0.17 1:025 1.0.50 1 1.00 SLEC-132.8% [• Baseline El Day 1 '•O• Day 2 • Day 3 • Day 4 • Day 5 Figure 26. Electrical conductance--Mean baseline and post-patch application values with varying molar ratios of 1.0% SLS:SLEC-13. 150 '• 100 -- ._E 50 o SLS10% 1:008 1 0.10 1'013 1:017 1:0.25 1 0.50 1'100 SLEC-1328% I-• Baseline • Day 1 .'. '(• Day 2 %F•] Day 3 • Day 4 • Day 5 Figure 2D. Laser Doppler flowmetry--Mean baseline and post-patch application values with varying molar ratios of 1.0% SLS:SLEC-13. Day 2, to 1:0.09 on Day 3, 1:0.14 on Day 4, and 1:0.15 on Day 5. On Day 8, the ratio returned to the Day 2 ratio. For the panelists treated with SLS and SLEC-13 (Table IV), a mean molar ratio of 1:0.08 induced •50% of the SLS value on Day 2. The ratio declined on subsequent days to 1:0.09 on Day 3, 1:0.11 on Day 4, and 1:0.16 on Day 5. On Day 8, the mean molar ratio returned to the Day 2 ratio. A statistical difference was found between the two groups of panelists only on Day 4 (Table V). LASER DOPPLER FLOWMETRY MEASUREMENTS In the group of panelists treated with mixtures of SLS and SLEC-5 (Table III), the mean
Purchased for the exclusive use of nofirst nolast (unknown)
From: SCC Media Library & Resource Center (library.scconline.org)